the Creative Commons Attribution 4.0 License.
the Creative Commons Attribution 4.0 License.
 | 09 Nov 2022
Qualitative and quantitative monitoring of drinking water through the use of a smart electronic tongue
Alvaro A. Arrieta
Said Marquez
Jorge Mendoza
The aim of this work was to evaluate a smart electronic tongue device as an alternative for qualitative and quantitative monitoring of drinking water. The smart electronic tongue consisted of a voltametric polypyrrole sensor array, linked with a multi-channel electronic system (multipotentiostat) based on PSoC (programable system on chip) technology controlled by a smartphone with a data acquisition and control app. This device was used in the monitoring of drinking water from the Sincelejo city water supply system; also, water samples collected and analyzed by the public health agency were used. The voltammetric measurements carried out with the smart electronic tongue showed cross-sensitivity of the polypyrrole sensor array, which allowed the discrimination of the samples through of principal component analysis by artificial neural networks. In addition, the voltammetric signals registered with the smart electronic tongue allowed, through partial least square (PLS) by artificial neural networks analysis, estimating the concentrations of some important analytes in the evaluation of the physicochemical quality of drinking water with R2 values higher than 0.70. The results allowed to conclude that the smart electronic tongue can be a valuable analytical tool that allows, in a single measure, to perform qualitative and quantitative chemical analysis (alkalinity, calcium, residual chlorine, chlorides, total hardness, phosphates, magnesium, and sulfates), it is also a fast, portable method that can complement traditional analyzes.


In recent decades, there has been an increase in interest and concern for the quality control of food, drinking water, beverages, and, in general, products for human consumption. To accomplish this control, in addition to reliable methods, it has been sought to have fast methods that allow real time and online surveillance. In the particular case of drinking water, analyses are usually carried out using techniques and methods that mostly require sophisticated and specialized equipment, such as UV–vis spectrometers, chromatographs, mass spectrometers, infrared spectrometers, and atomic absorption spectrometers, among others (Richardson and Ternes, 2017; Rice et al., 2017). In general, this kind of equipment is expensive and requires qualified personnel for their handling, they are also bulky equipment that consume significant amounts of energy and can only operate in facilities or laboratories suitable for their operation. Furthermore, most of the analyses require sample pre-treatment, long processing times, and generate a considerable amount of chemical waste. These conditions and restrictions in traditional analytical approaches have led to the development of cheaper, faster, easier, and more efficient alternative technologies. The above has led to the generation of new technologies, among which there are the electronic tongues (Arrieta et al., 2019; Ataş et al., 2020; Dias et al., 2015; Legin et al., 2019).
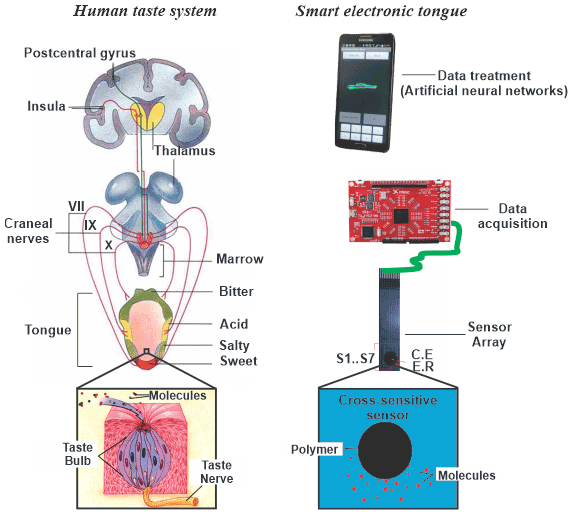
Figure 1Functional similarities between the human taste system and an artificial system (smart electronic tongue).
Electronic tongues are analytical devices, made up of a non-specific chemical sensor array, with cross-sensitivity, coupled to a multichannel measurement system and an app or software that allows pattern recognition (Vlasov et al., 2005). A certain analogy can be established between the human gustatory taste system and electronic tongues, in the sense that we can find some approximations in its structure and principles of operation. Figure 1 presents a comparative scheme that shows the similarities between the functioning of the human taste system and the artificial system.
Although the electronic tongue devices have used various analytical principles such as optical, mass, and frequency measurements, among others (Khan et al., 2016; Li et al., 2019; Kovacs et al., 2020; Sehra et al., 2004; Aydemir and Ebeoglu, 2018), the ones based on electrochemical measurements have been the most widely accepted. Devices based on potentiometric and voltammetric electrochemical measurements have been more widely accepted and have shown their effectiveness in the analysis of different types of beverages (Arrieta et al., 2019; Belugina et al., 2020; Titova and Nachev, 2020; Marx et al., 2017). Electronic tongues based on voltammetric measurements have advantages such as greater ease of sensors elaboration, low sensitivity to electronic noise, high analytical sensitivity, and versatility in terms of the voltammetric technique used (square wave, cyclic, pulse, etc.).
Electronic tongues have been used in the analysis of mineral waters (Sipos et al., 2012), waste waters (Legin et al., 2019), bottled waters (Dias et al., 2015), and qualitative (sample classification) and quantitative analyses on analytes such as Na+, K+, Ca2+, Cl−, NaCl, NaN3, NaHSO3, ascorbic acid, and NaOC (Winquist et al., 2011; Ataş et al., 2020), among others. However, no reports have been found on the application of this technology in the analysis of drinking water from distribution networks and on the analytes of greatest interest in the evaluation of its physicochemical quality such as hardness, alkalinity, chlorides, sulfates, chlorine, etc.
The reported electronic tongue devices are mostly laboratory equipment, which limits their portability for on-site analysis. In this work, the application of a portable smart electronic tongue is reported, made up of a miniaturized polypyrrole (PPy) sensor array, a multichannel device made under PSoC (programable system on chip) technology and a smartphone equipped with an Android app. The recorded data were analyzed with methods of pattern recognition and regression by partial least squares based on artificial neural networks. This smart electronic tongue was used to qualitatively and quantitatively analyze samples taken from the 22 points (hydrants) of the distribution system.
2.1 Collection of samples and sampling area
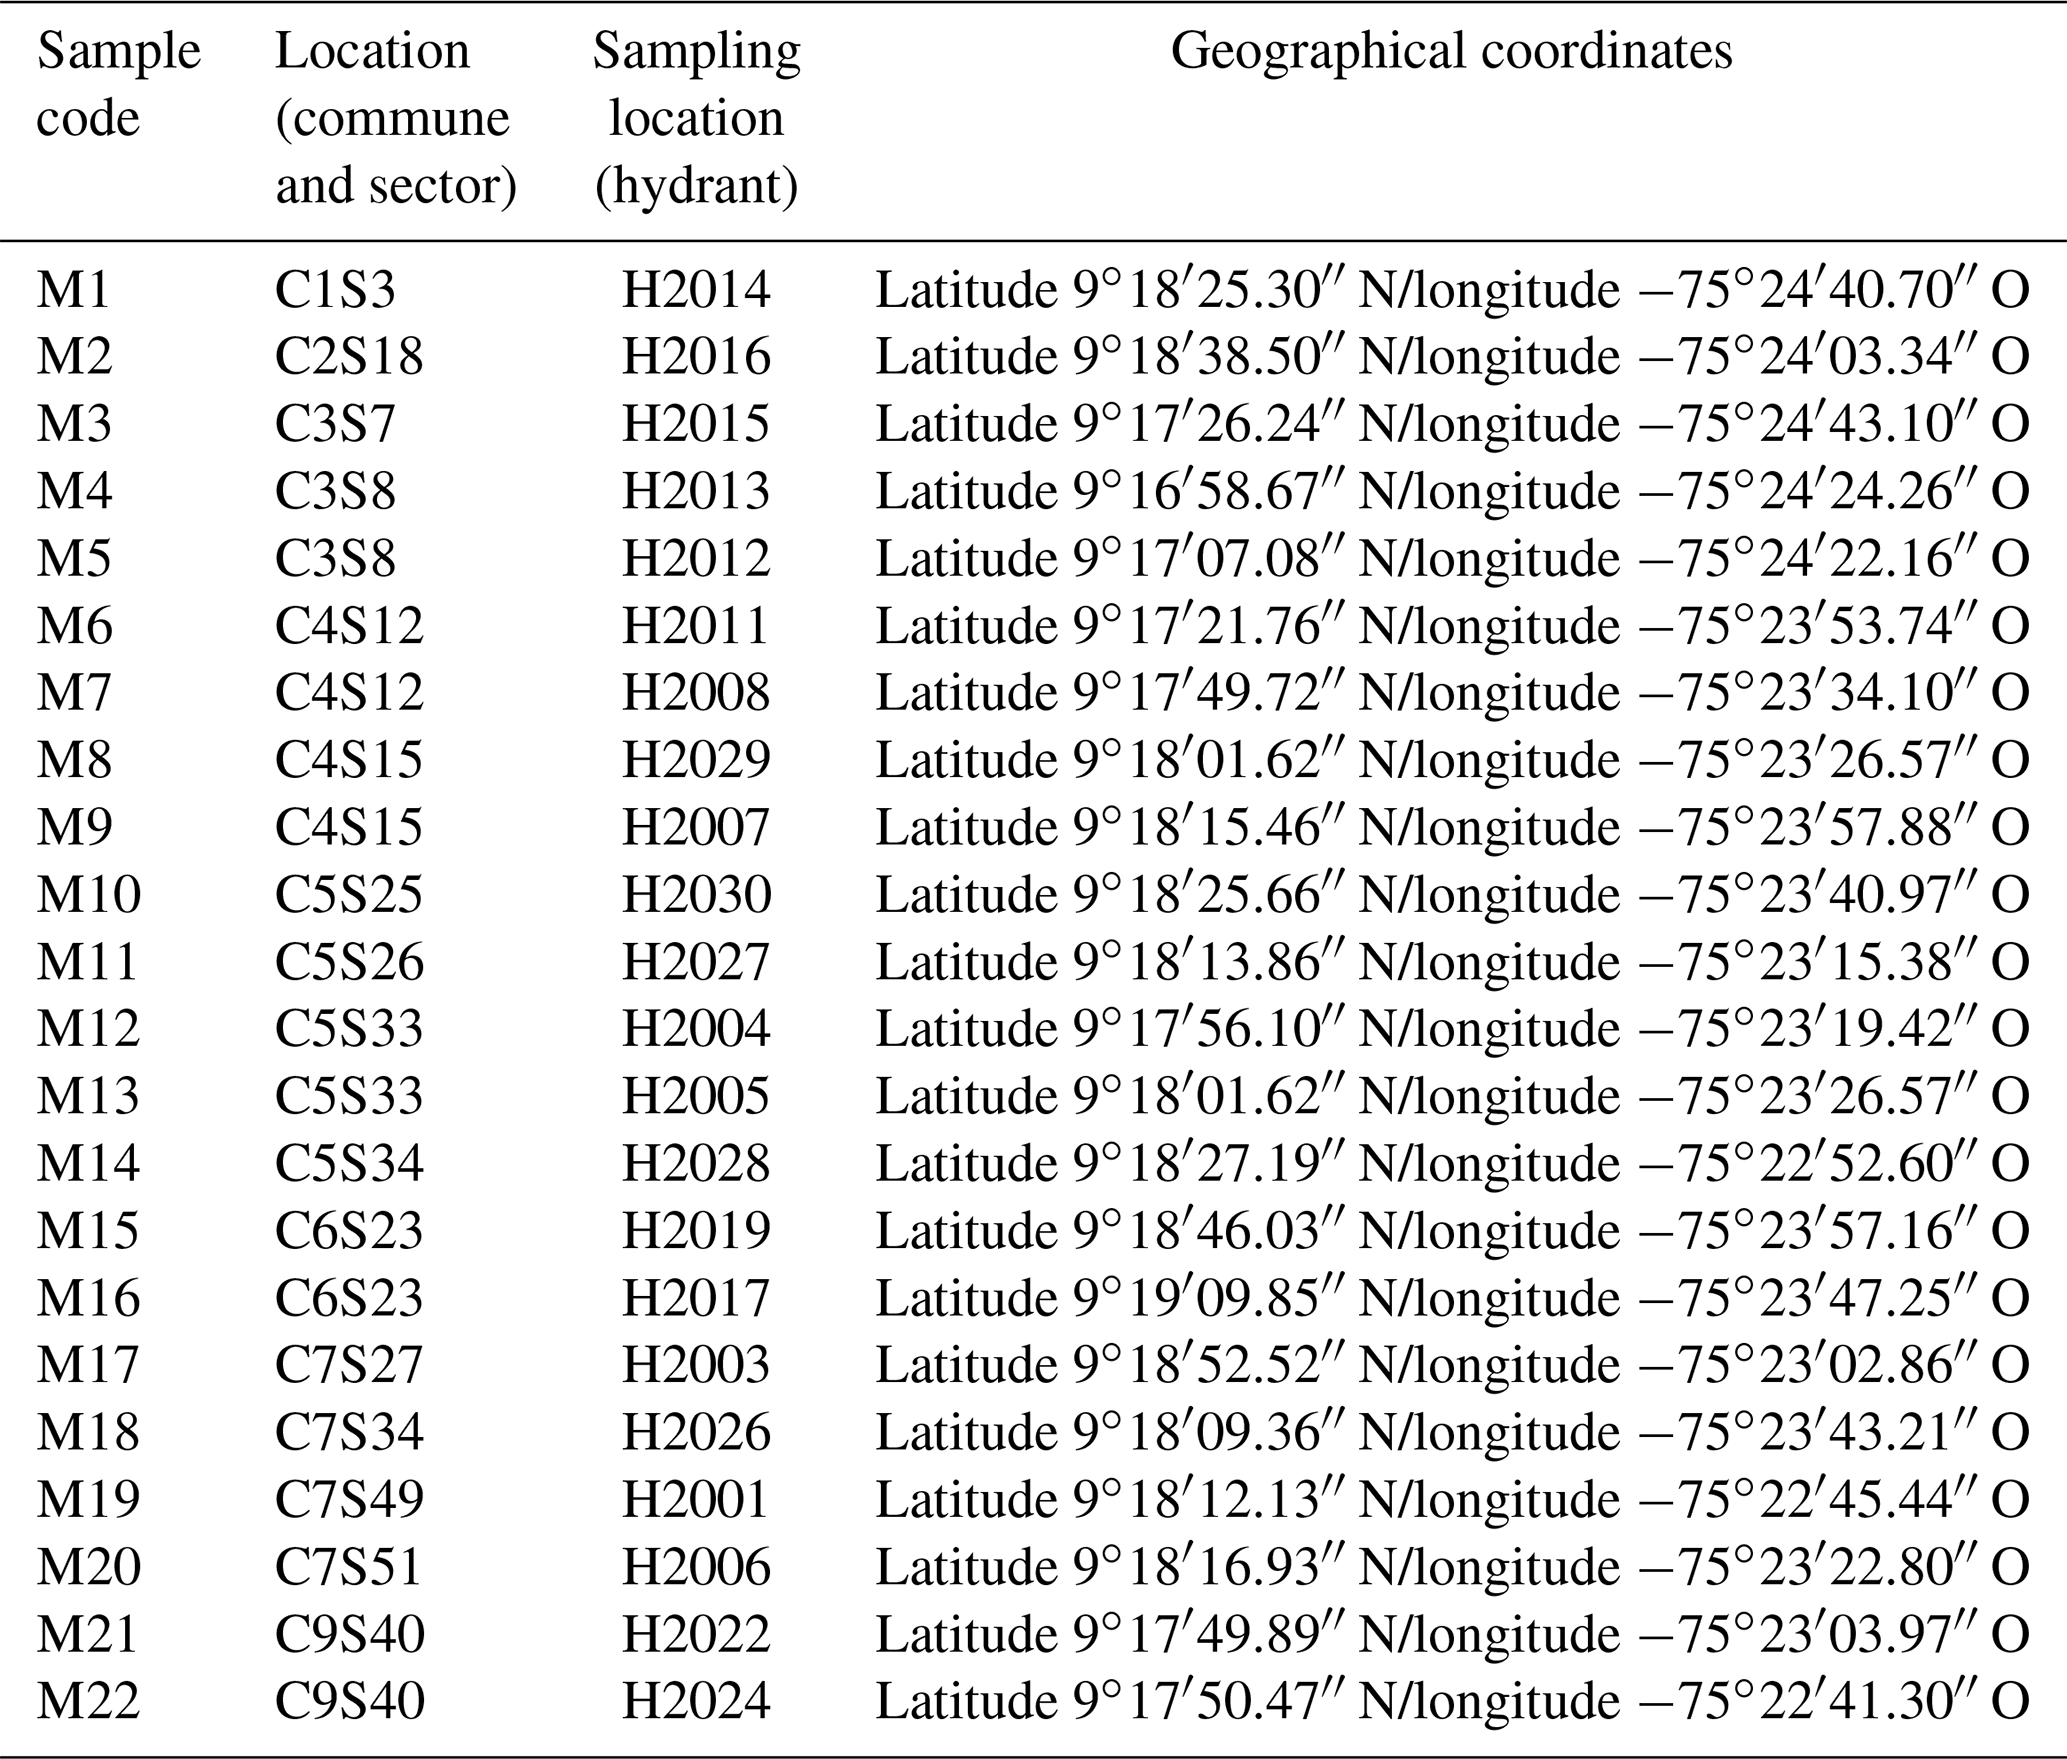
The samples were taken from the drinking water supply network at the hydrants defined by the drinking water service provider company (ADESA SAESP), located in communities 1, 2, 3, 4, 5, 6, 7, and 9 of the city of Sincelejo – Colombia (Sincelejo mayorship, 2017), located in the northeast of the country at 9∘18′′ N longitude, −75∘23′′ latitude, west of the Greenwich meridian, altitude of 213 m.s.l. For the sampling, the national guidelines on the minimum number of samples and the distribution of sampling points established for the populations according to their number of inhabitants were taken into account.
The sampling hydrants were defined taking into account the programming of the operating company of the water supply system and the entity of surveillance and control of the quality of drinking water. Table 1 presents the summary of the programming of the sampling carried out, in which the location or geographical area was noted; commune (C), sector (S), and the place of sampling point or hydrant (H). For the sampling procedure, the protocols established by the national health authority were followed (National Institute of Health et al., 2019).
The samples were divided into aliquots to carry out the different analyses. The characterization of the physicochemical analyzed parameters was carried out in the facilities of the departmental reference laboratory of public health of the Department of Sucre, an entity in charge of exercising control and monitoring of water for human consumption and its characteristics. The methods and techniques used for each of the parameters analyzed were those established in the standard analysis methods required by national regulations (Richardson and Ternes, 2017; Rice et al., 2017).
2.2 Smart electronic tongue device and measurements
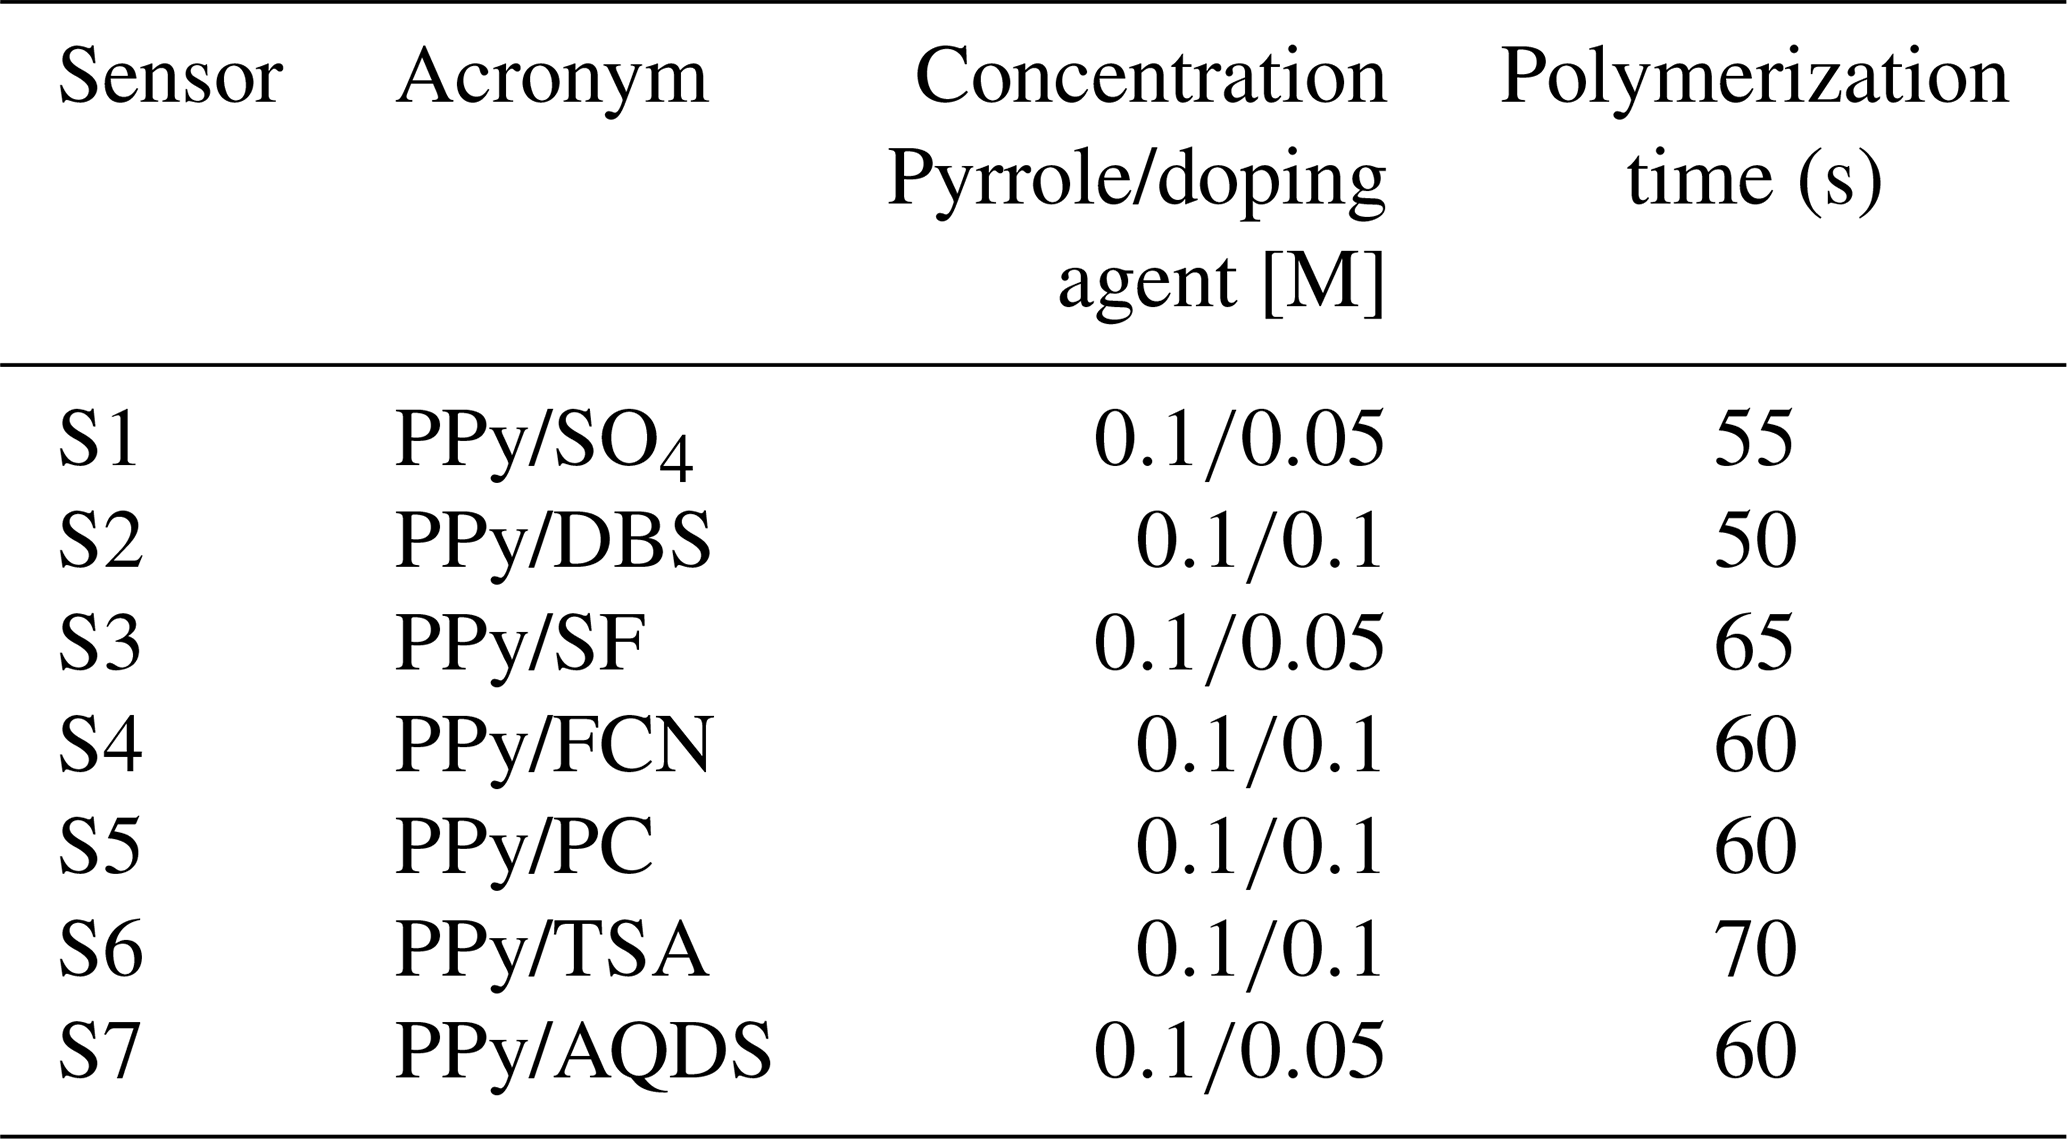
The smart electronic tongue developed in our laboratory consisted of a voltammetric PPy sensor array and a portable multipotentiostat controlled with a smartphone. For the elaboration of the sensor array, a card with screen-printed electrodes from BVT Technologies (AC9C) was used, which consists of an auxiliary or counter electrode (CE), an Ag/AgCl reference electrode (ER), and seven working electrodes of graphite, which were used as substrates for the generation of the sensors. Thus, the sensor array consisted of seven PPy voltammetric sensors doped with seven different doping agents: PPy/DBS (PPy doped with sodium dodecyl benzene sulfonate), PPy/SO4 (PPy doped with sodium sulfate ), PPy/SF (PPy doped with sodium persulfate), PPy/FCN (PPy doped with sodium ferrocyanide), PPy/TSA (PPy doped with p-toluene sulfonic acid), PPy/AQDS (PPy doped with disodium salt of the acid anthraquinone-2,6-disulfonic), and PPy/PC (PPy doped with lithium perchlorate).
The sensor array was prepared by chronoamperometric electropolymerization of pyrrole at 0.8 V, using an EG & G 2273 PAR potentiostat/galvanostat, controlled with PowerSuite software. The PPy with each of the dopants was electrodeposited on the graphite substrates arranged in a circular way on the commercial AC9C card. Table 2 shows the experimental conditions used in the synthesis of the sensor array.
Table 2Experimental conditions for the electropolymerization of the sensor array.
The portable multipotentiostat was made on a FREESOC card with a PSoC 5LP microchip (programmable system on chip), which was programmed with the PSoC creator software. This electronic device was designed to simultaneously register the voltammetric signals of the seven sensors of the array through seven measurement channels. In addition, a Bluetooth card was incorporated for data transmission to a smartphone equipped with an Android app designed to control the device and record data. Details on the electrochemical polymerization techniques, the development of the electronic device, and the control Android app have been previously reported (Arrieta and Fuentes, 2016; Arrieta et al., 2015, 2016). Figure 2 presents an image of the smart electronic tongue, and its three fundamental components are highlighted.
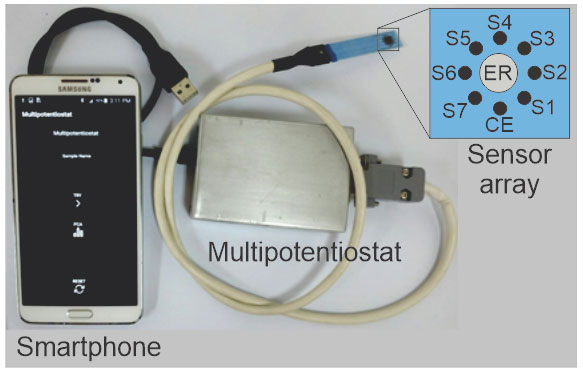
Figure 2Image of the smart electronic tongue formed by the miniaturized sensor array, portable electronic device, and smartphone with an Android app.
The measurements carried out with the smart electronic tongue were carried out on 10 mL of sample at room temperature and without previous treatment. Seven replicates of each measure were made. The voltammetric signals were recorded at a sweep rate of 100 mV s−1, in a potential range of −1.0 to 0.5 V with an initial potential of 0.0 V.
2.3 Data processing and evaluation of the qualitative and quantitative analysis carried out with the smart electronic tongue
From the obtained signals during the measurements carried out with the smart electronic tongue, the current data generated by the sensor array were recorded. Each sensor generated a voltammogram of each sample, composed of 100 data, which allowed having 700 data with the entire sensor array, each one of them were a variable in the data matrix for each sample, which constituted a species “fingerprint” of the sample. Thus, when analyzing all the samples, a matrix of 107 800 data was constructed (700 variables × 22 samples × 7 replicates).
To validate the classification capacity (qualitative analysis) in drinking water samples, the matrix was subjected to a pattern recognition analysis by applying artificial neural networks for principal component analysis. By evaluating the results and the reproducibility of the method, the measurement procedure was repeated on a different group of samples, sampled 15 d after the first discrimination test and with the same sampling protocol, measurement with the smart electronic tongue and treatment of data were applied. The purpose of these experiments was to verify the repeatability of the results obtained with the smart electronic tongue.
On the other hand, a quantitative analysis was carried out from regression models using artificial neural networks for partial least squares to establish a correlation between the voltammetric measurements registered with the smart electronic tongue, and the concentrations of eight physicochemical parameters related to drinking water quality (alkalinity, calcium, residual chlorine, chlorides, total hardness, phosphates, magnesium, and sulfates) were evaluated. The physicochemical parameters were determined using the traditional methods validated by the norms and standardized methods (Richardson and Ternes, 2017; Rice et al., 2017). That is, created prediction models were generated from the data obtained in the characterization process with the smart electronic tongue (matrix X, independent variables) and the physicochemical parameters determined using the traditional methods in each water sample (Y matrix, dependent variables). In this way, the concentrations of the physicochemical parameters of drinking water determined by traditional methods were evaluated against those predicted by smart electronic tongue through regression models.
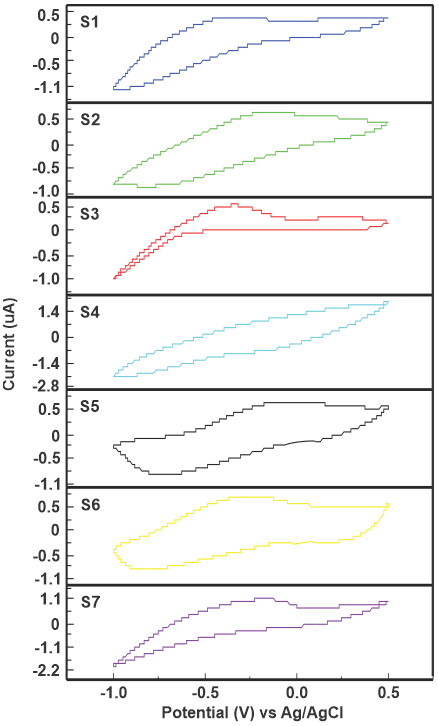
Figure 3Voltammetric signals from the smart electronic tongue sensor array recorded in the drinking water sample M1 (C1S3-H2014).
The chemometric treatment of the data was carried out using specific artificial neural networks designed under the MATLAB V 7.12 program using Neural Network Toolbox v.3.0 (Kong et al., 2017). The data were not pretreated and to select the number of latent variables, a “cross-validation” was performed before building the prediction model. Calibration and validation were performed from the concentrations determined by the methods and techniques established in the standard analysis methods required by national regulations (Richardson and Ternes, 2017; Rice et al., 2017).
3.1 Voltammetric response of smart electronic tongue
Once the samples were collected at the sampling points, the respective measurements were done by using the smart electronic tongue in an aliquot of 10 mL and the measurement time was 4 min per sample. The voltammetric signals showed cross sensitivity in the sensors; each sensor presented a particular response in the same sample, which means that each one provided information about the analyzed sample, which constitutes the “fingerprint”, with anodic and cathodic processes of the PPy against the samples (Arrieta et al., 2004). In Fig. 3, the response of the sensor array against sample M1 (C1S3-H2014) is presented as an example. It can be showed in the graphs that the voltammetric signal of the sensor S1 (PPy/SO4) showed an anodic process at −0.249 V and in the cathodic sweep a reduction process could be observed at −0.875 V. The response of the sensor S2 (PPy/DBS) showed a redox process, with an oxidation peak at −0.109 V and a wide reduction peak in the cathodic scan at −0.799 V.
The signal recorded with S3 sensor (PPy/SF) consisted of two anodic processes at 0.249 and −0.351 V. On the other hand, the voltammetric response of S4 sensor (PPy/FCN) presented a signal with poorly defined anodic and cathodic process at 0.287 and −0.124 V, respectively. The voltammetric responses of the S5 sensor (PPy/PC) and S6 (PPy/TSA) showed in both cases a redox process, composed of an anodic peak at 0.03 V for PPy/PC and −0.252 V for PPy/TSA. Whereas with cathodic scanning it could be seen that PPy/PC presented the reduction peak at −0.747 V, while the PPy/TSA cathodic scanning showed the reduction peak at −0.821 V. The voltammetric signal of the S7 sensor (PPy/AQDS) presented an oxidation process in the cathodic wave at 0.202 V.
Besides this, the cross sensitivity was evaluated, which is the capacity of the sensor array to generate particular signals in front of each one of the samples. In Fig. 4, the behavior of the S1 sensor (PPy/SO4) against some water samples taken at different sampling points (M1, M2, M3, M4, and M5) is shown as an example. Thus, the main differences are observed in the position of the peaks (redox potentials) of each of the sensors and the shapes of the curve. This allows obtaining information from the analyzed water samples. Starting from this fact, and to extract the information contained in the signals, a pattern recognition analysis was performed using artificial neural networks for principal component analysis.
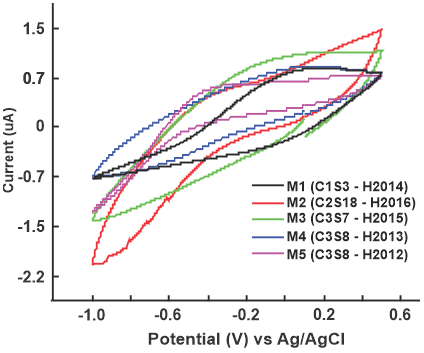
Figure 4Voltammetric signals of the S1 sensor (PPy/SO4) recorded in different samples of drinking water.
In summary, it could be shown that the shape and position (redox potentials) of the peaks in the voltammetric signals were markedly different in each of the sensors and a different signal pattern was recorded in each sample, allowing them to have together a “fingerprint” of each one. In general terms, the signals were related to the entry and exit of ionic species from the water samples in the polymeric film of the PPy sensor to maintain its electroneutrality, which is why the obtained signals contain information of each of the samples analyzed (Arrieta et al., 2004).
3.2 Qualitative analysis
From the recorded signals, a matrix was constructed with the data obtained in each of the measurements. The matrix was used to perform a pattern recognition analysis to classify the samples, Fig. 5 shows the result obtained from the pattern recognition analysis by artificial neural networks for principal components, applied to the values supplied by the voltammetric signals recorded for the different water samples. The two principal components represented show a variance of 72.09 %.
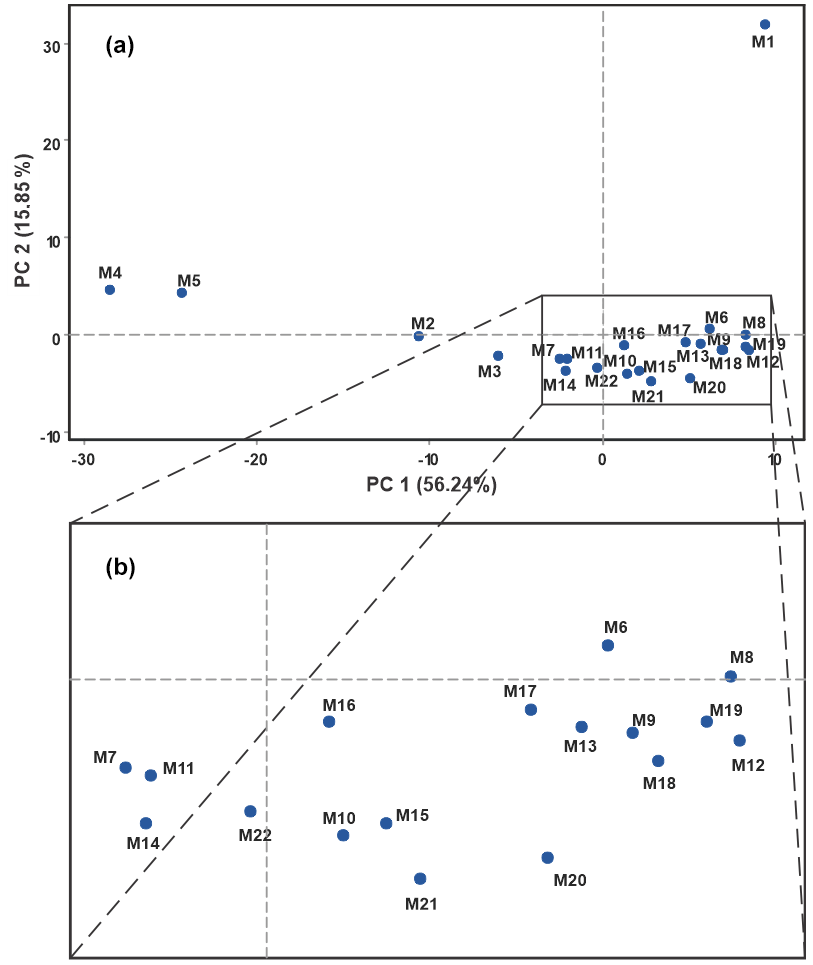
Figure 5Plot of principal component score of signals collected in drinking water samples by smart electronic tongue.
In Fig. 5, each point corresponds to a sample taken from a hydrant or sampling point taken in the respective geographical area (commune C, sector S, and hydrant H). The first principal component (PC 1) summarizes the most information with 56.49 % and the second principal component (PC 2) also collects a significant amount of 15.85 %. As can be seen, the different analyzed samples are remarkably distributed in the plane of the principal components with a higher concentration close to zero in both axes. In the area located in the lower right part of the graph (Fig. 5a), groups of samples may appear to be overlapping due to the high concentration of points (samples). However, when enlarging the area, it can be seen that none of the samples overlap (Fig. 5b).
The samples with the greatest separation in the plane of the principal components: M1 (C1S3-H2014), M2 (C2S18-H2016), M3 (C3S7-H2015), M4 (C3S8-H2013), and M5 (C3S8-H2012) belong to communes 1, 2, and 3, which are found in the western part of the city, with sample M1 being the one with the highest degree of separation and the only sample from commune 1. On the other hand, samples M4 and M5 belong to the same commune and the same sector, presenting a certain proximity. This trend in the spatial distribution of the samples without forming defined groups in the principal components plane may be due to the fact that the water supply is carried out from the main treatment site and reaches different points where temporary storage is carried out with re-pumping towards the geographical location areas. This distribution process with different storage sites can generate slight differences in the composition of some components due to the lack of homogeneity in the re-pumping points where there may be differences in storage temperature, possible mixtures, and different cleaning protocols, among others. In addition to other factors such as differences in sampling hours, maintenance of distribution lines, etc., this result showed the discrimination capacity of the smart electronic tongue against drinking water samples.
Furthermore, a second test was carried out to corroborate the quality and reproducibility of these results. This trial consisted of repeating the experiences after 15 d. For this, a new group of samples collected at the same points was used and then followed with the same protocols for sampling and recording signals with the smart electronic tongue. In this way, after treating the data with the artificial neural network method for principal component analysis, a new principal component scores graph was generated from the new experiments.
When comparing the distribution and the positions of the samples with those obtained from the experiments carried out in the first test (Fig. 5), a great similarity in the results could be observed . The information collected for PC 1 and PC 2 was 62.15 % and 9.89 %, respectively, for a total of 72.04 % of the information collected for the total variance, a value similar to that obtained in the first trial (72.09 %). Although there are small variations, which may be the product of differences between the physicochemical characteristics of the samples, there is a high degree of reproducibility.
3.3 Quantitative analysis
The ability of the smart electronic tongue to provide quantitative information of the water samples under study was explored by obtaining correlations between the voltammetric measurements recorded by the smart electronic tongue and the concentration of some compounds or substances present in drinking water samples. For this, the data of the two sets of 22 samples were taken to guarantee the robustness of the resulting models.

Figure 6Regression models of physicochemical parameters (alkalinity, calcium, hardness, and phosphates) generated by smart electronic tongue and traditional methods of chemical analysis.
To carry out the extraction of quantitative information, regression models of artificial neural networks for partial least squares were used, and eight relevant physicochemical parameters were chosen in the evaluation of the quality of drinking water (hardness, alkalinity, chlorides, residual chlorine, sulfates, magnesium, calcium, and phosphates).
The results of the application of the regression analysis are shown in Figs. 6 and 7 (the results were divided into two figures to improve the visualization). Calibration and validation were performed from the concentrations determined by traditional methods of analysis as explained in the materials and methods section. In Fig. 6, the regression graphs obtained from the application of the models on the parameters alkalinity, calcium, hardness, and phosphates are presented.

Figure 7Regression models of physicochemical parameters (residual chlorine, chlorides, magnesium, and sulfates) generated by smart electronic tongue and traditional methods of chemical analysis.
It could be seen that the R2 (coefficient of determination) reached values of 0.701 in the case of phosphate, 0.818 for alkalinity, and 0.828 and 0.866 for calcium and hardness, respectively. Therefore, it can be considered that the smart electronic tongue presented the ability to predict the concentration of these substances.
In Fig. 7, the graphs obtained for the physicochemical parameters of residual chlorine, chlorides, magnesium, and sulfates are presented. In this case, a linear correlation can be observed with R2 values of 0.315 for residual chlorine, 0.70 for chlorides, 0.788 for sulfate content, and 0.825 for magnesium content. The R2 values obtained in the case of residual chlorine show low correlation, which may be due to the fact that residual chlorine is a not stable parameter.
The instability of the residual chlorine in the water can be caused by the volatility of the chlorine, which is highly affected by light and high temperatures, and although the samples were refrigerated in the sampling process, the city of Sincelejo is a city within a tropical area that registers an annual average temperature of 27 ∘C, which can affect both the traditional chemical analyzes carried out in the reference laboratory and the measurements carried out with the smart electronic tongue.
As mentioned above, studies have been reported on the use of electronic tongues for water analysis in which the correlation coefficients are lower than those obtained in this work. However, the strict comparison of the results obtained becomes inaccurate because the analytes (analytical parameters), sample types, and nature of the in situ analytical procedure on which this work focuses are different from those reported by other authors (Gutiérrez-Capitán et al., 2019; Carbó et al., 2018).
The monitoring of the quality of drinking water through devices capable of providing information quickly, at low cost, and that allow measurements to be carried out in situ can help improve the quality of life and health in remote populations. This work evaluated the application of a portable smart electronic tongue, made with a PPy sensor array, a multipotentiostat controlled by a smartphone as a drinking water monitoring device. The results of the study allowed to conclude that the voltammetric signals registered by the sensor array of the smart electronic tongue in samples of drinking water showed cross sensitivity, that is to say, each sensor in the array registered a different signal against one drinking water sample. Also, the signals of the recorded drinking water samples were different from each other, constituting in this a pattern or “fingerprint” of each analyzed sample. Each measurement took about 4 min to carry out, which represents a reduced time when compared with the traditional methods of chemical analysis used in the physicochemical characterizations of water samples.
This behavior allowed, through the application of artificial neural networks for principal components analysis, to discriminate between drinking water samples, a fact that reflects a good discrimination capacity of the smart electronic tongue. The results obtained with the analysis of the 22 samples and their replicas showed discrimination capacity of the smart electronic tongue, with reproducible discrimination results.
Also, it could be seen that the smart electronic tongue provided quantitative information of some of the physicochemical parameters in the evaluation of the quality of drinking water. For this, the data were treated using regression models, with the aim of extracting quantitative information from the signals. Coefficient of determination values higher than 0.70 were established, which evidenced the capacity of smart electronic tongue to provide information on substances of analytical interest that determine the quality of drinking water.
The code used in this work has restricted access to the public due to confidentiality commitments.
The data that support this work and its results are not available to be shared because they are under confidentiality agreements. Access to the data can be requested from the Secretary of Public Health of the Department of Sucre.
The collection of samples and the measurements with the smart electronic tongue were performed by SM, the elaboration of the sensor array and the integration in the smart electronic tongue were carried out by AAA, and the analysis and interpretation of data were performed by JM. The writing of the document and analysis of the results were carried out by the team.
The contact author has declared that none of the authors has any competing interests.
Publisher's note: Copernicus Publications remains neutral with regard to jurisdictional claims in published maps and institutional affiliations.
The authors acknowledge the financial support provided by the University of Sucre and Colciencias, as well as the invaluable collaboration of Gustavo Tous (RIP) and Anibal Arrazola, officials of the Secretary of Public Health of the Department of Sucre.
This research has been supported by Colciencias (grant no. RC 0410).
This paper was edited by Luuk Rietveld and reviewed by two anonymous referees.
Arrieta, A., Apetrei, C., Rodriguez-Mendez, M. L., and De Saja, J. A.: Voltammetric sensor array based on conducting polymer-modified electrodes for the discrimination of liquids, Electrochim. Ac., 49, 4543–4551, https://doi.org/10.1016/j.electacta.2004.05.010, 2004.
Arrieta, A., Fuentes, O., and Palencia, M.: Android and PSoC Technology Applied to Electronic Tongue Development, Res. J. Appl. Sci. Eng. Technol., 10, 782–788, https://doi.org/10.19026/rjaset.10.2431, 2015.
Arrieta, A., Diaz, J., and Fuentes, O.: Optimization of the synthesis of polypyrrole for the elaboration of a network of sensors electrochemical (electronic tongue), Rev. Soc. Quím. Perú, 82, 152–161, http://www.scielo.org.pe/pdf/rsqp/v82n2/a06v82n2.pdf (last access: 15 October 2022), 2016.
Arrieta, A. A. and Fuentes, O.: Portable electronic tongue for the analysis of raw milk based on PSoC (Programmable System on Chip) and Android technology, Ingeniare, Revista Chilena de Ingeniería, 24, 445–453, https://doi.org/10.4067/S0718-33052016000300009, 2016.
Arrieta, A. A., Arrieta, P. L., and Mendoza, J. M.: Analysis of coffee adulterated with roasted corn and roasted soybean using voltammetric electronic tongue, Acta Sci. Pol. Technol. Aliment., 18, 35–41, https://doi.org/10.17306/J.AFS.2019.0619, 2019.
Ataş, H. B., Kenar, A., and Taştekin, M.: An electronic tongue for simultaneous determination of , , K+ and in water samples by multivariate calibration methods, Talanta, 217, 1–12, https://doi.org/10.1016/j.talanta.2020.121110, 2020.
Aydemir, F. and Ebeoglu, M. A.: A QCM Sensor Array-Based Electronic Tongue with the Optimized Oscillator Circuit Using FPGA, IEEE T. Instrum. Meas., 67, 431–438, https://doi.org/10.1109/TIM.2017.2779318, 2018.
Belugina, R. B., Monakhova, Y. B., Rubtsova, E., Becht, A., Schollmayer, C., Holzgrabe, U., Andrey, V. L., and Kirsanov, D. O.: Distinguishing paracetamol formulations: Comparison of potentiometric “Electronic Tongue” with established analytical techniques, J. Pharmaceut. Biomed. Anal., 188, 1–7, https://doi.org/10.1016/j.jpba.2020.113457, 2020.
Carbó, N., López, J., Garcia-Castillo, F. J., Tormos, I., Olivas, E., Folch, E., Alcañiz, M., Soto, J., Martínez-Máñez, R., and Martínez-Bisbal, M. C.: Quantitative Determination of Spring Water Quality Parameters via Electronic Tongue, Sensors, 18, 40, https://doi.org/10.3390/s18010040. 2018.
Dias, L. G., Alberto, Z., Veloso, A. C. A., and Peres, A. M.: Electronic tongue: a versatile tool for mineral and fruit-flavored waters recognition, J. Food Meas. Character., 10, 264–273, https://doi.org/10.1007/s11694-015-9303-y, 2015.
Gutiérrez-Capitán, M., Brull-Fontserè, M., and Jiménez-Jorquera, C.: Organoleptic Analysis of Drinking Water Using an Electronic Tongue Based on Electrochemical Microsensors, Sensors, 19, 1435, https://doi.org/10.3390/s19061435, 2019.
Khan, M., Khalilian, A., and Kang, S.: A High Sensitivity IDC-Electronic Tongue Using Dielectric/Sensing Membranes with Solvatochromic Dyes, Sensors, 16, 1–20, https://doi.org/10.3390/s16050668, 2016.
Kong, X., Hu, C., and Duan, Z.: Neural Networks for Principal Component Analysis, in: Principal Component Analysis Networks and Algorithms, Springer, Singapore, 47–73, https://doi.org/10.1007/978-981-10-2915-8, 2017.
Kovacs, Z., Szöllősi, D., Zaukuu, J.-L. Z., Bodor, Z., Vitális, F., Aouadi, B., Zsom-Muha, V., and Gillay, Z.: Factors Influencing the Long-Term Stability of Electronic Tongue and Application of Improved Drift Correction Methods, Biosensors, 10, 1–22, https://doi.org/10.3390/bios10070074, 2020.
Legin, E., Zadorozhnaya, O., Khaydukova, M., Kirsanov, D., Rybakin, V., Zagrebin, A., Ignatyeva, N., Ashina, J., Sarkar, S., Mukherjee, S., Bhattacharyya, N., Bandyopadhyay, R., and Legin, A.: Rapid Evaluation of Integral Quality and Safety of Surface and Waste Waters by a Multisensor System (Electronic Tongue), Sensors, 19, 1–15, https://doi.org/10.3390/s19092019, 2019.
Li, S., Li, K., Li, X., and Chen, Z.: A colorimetric electronic tongue for rapid discrimination of antioxidants based on the oxidation etching of nano-triangular silver by metal ions, ACS Appl. Mater. Interfac., 11, 37371–37378, https://doi.org/10.1021/acsami.9b14522, 2019.
Marx, I. M. G., Rodrigues, N., Dias, L. G., Veloso, A. C. V., Pereira, J. A., Drunkler, D. A., and Peres, A. M.: Quantification of table olives' acid, bitter and salty tastes using potentiometric electronic tongue fingerprints, LWT – Food Sci. Technol., 79, 394–401, https://doi.org/10.1016/j.lwt.2017.01.060, 2017.
National Institute of Health, Subdirectorate of the National Laboratory Network, Laboratory Surveillance Program of Water Quality for Human Consumption, and Bogota National Institute of Health: Manual of procedures for taking, preserving and sending samples to the National Reference Laboratory, https://www.ins.gov.co/Direcciones/RedesSaludPublica/DocumentosdeInteresSRNL/Manual_toma_envio_muestras_INS-2019.pdf (last access: 15 October 2022), 2019.
Rice, E. W., Baird, R. B., and Eaton, A. D.: Standard Methods for the Examination of Water and Wastewater, in: 23rd Edition, American Public Health Association, American Water Works Association, Water Environmental Federation, New York, http://yabesh.ir/wp-content/uploads/2018/02/Standard-Methods-23rd-Perv.pdf (last access: 15 October 2022), 2017.
Richardson, S. D. and Ternes, T. A.: Water Analysis: Emerging Contaminants and Current Issues, Anal. Chem., 90, 398–428, https://doi.org/10.1021/acs.analchem.7b04577, 2017.
Sehra, G., Cole, M., and Gardner, J. W.: Miniature taste sensing system based on dual SH-SAW sensor device: an electronic tongue, Sensors Actuat. B, 103, 233–239, https://doi.org/10.1016/j.snb.2004.04.055, 2004.
Sincelejo mayorship: Sincelejo land use plan, agreement 177 of 2017, Urban Regulation, Sincelejo Mayor's Office, 2017.
Sipos, L., Kovács, Z., Sági-Kiss, V., Csiki, T., Kókai, Z., Fekete, A., and Héberger, K.: Discrimination of mineral waters by electronic tongue, sensory evaluation and chemical analysis, Food Chem., 135, 2947–2953, https://doi.org/10.1016/j.foodchem.2012.06.021, 2012.
Titova, T. and Nachev, V.: “Electronic tongue” in the Food Industry, Food Sci. Appl. Biotechnol., 3, 71–76, https://doi.org/10.30721/fsab2020.v3.i1.74, 2020.
Vlasov, Y., Legin, A., Rudnitskaya, A., Di Natale, C., and D'Amico, A.: Nonspecific sensor arrays (“electronic tongue”) for chemical analysis of liquids (IUPAC Technical Report), Pure Appl. Chem., 77, 1965–1983, https://doi.org/10.1351/pac200577111965, 2005.
Winquist, F., Olsson, J., and Eriksson, M.: Multicomponent analysis of drinking water by a voltammetric electronic tongue, Anal. Chim. Acta, 683, 192–197, https://doi.org/10.1016/j.aca.2010.10.027, 2011.