the Creative Commons Attribution 4.0 License.
the Creative Commons Attribution 4.0 License.
 | 18 Jul 2022
The evaluation of hydraulic reliability indices in water distribution networks under pipe failure conditions
Alireza Moghaddam
Alireza Faridhosseini
Hossein Rezaei
Roya Peirovi-Minaee
Ali Naghi Ziaei
In this research, reliability indicators of water distribution networks were evaluated under pipe failure conditions. The case studies included two benchmark networks and one real-life water distribution network in Iran with more hydraulic constraints. Some important reliability indicators were presented, such as resilience index, network resilience, modified resilience index, and minimum surplus head index. GANetXL was used to do the one-objective and two-objective optimization of the previously mentioned water distribution networks in order to not only minimize the cost but also maximize the reliability indicators. Moreover, the results of a statistical analysis for each pipe were used to determine the sensitive pipes that were of the most failure probability. GANetXL is an optimization tool in the Microsoft Excel environment and works based on a genetic algorithm. GANetXL has the capability of being linked to EPANET (hydraulic simulation software). The results obtained clearly showed that network resilience index was poor performance when compared with the other indexes under pipe failure conditions, especially in real-life networks that include small pipe diameters. It was also showed that if a water distribution network was optimized only in terms of cost, then there would be an unacceptable pressure drop at some nodes in case of pipe failure.
- Article
(1261 KB) -
Supplement
(4454 KB) - BibTeX
- EndNote


Water distribution networks (WDNs) are designed to provide users with a minimum acceptable level of supply in terms of pressure, availability, and water quality at all times under a range of operating conditions (Liserra et al., 2014; Eslami et al., 2022). Nowadays, WDNs have become complex and need huge investments in construction and maintenance (Fujiwara and Khang, 1990). As a result, there is an avid desire to improve their efficiency through minimizing their cost and maximizing their benefit (Alperovits and Shamir, 1977).
Optimal WDN design is a computationally complex problem because of its nonlinear nature and the constraints involved (Rouholamini et al., 2018). Therefore, finding a global optimal solution is difficult if we use optimization methods, as the nonlinearity is significant. In the last few decades, several researchers have broadly studied the design optimization problem of WDNs. The problems have been solved using linear, nonlinear, and various meta-heuristic methods. Linear and nonlinear methods were predominantly used in the period 1960–1990 (Alperovits and Shamir, 1977; Fujiwara and Khang, 1990; Jacoby, 1968; Lansey and Mays, 1989; Quindry et al., 1981; Watanatada, 1973). Linear methods applied to nonlinear problems have not resulted in optimal solutions. The nonlinear methods do not necessarily yield a global optimum, and the final solution is depended on the initial solution used as a starting point for the search procedure (Piratla, 2016). In addition, the use of discrete variables, specific size pipe diameters, limits the quality of the optimal solution obtained. These limitations led to the employment of meta-heuristics that use stochastic optimization methods.
Murphy and Simpson (1992) were the first researchers to use a simple genetic algorithm (GA) to optimally design water distribution systems. This model was applied to determine the lowest cost combination of pipe diameters and rehabilitation actions. GA has been integrated with a hydraulics simulator to optimize the solutions by many researchers (Lippai et al., 1999; Neelakantan et al., 2008; Savic and Walters, 1997; Simpson et al., 1994; Simpson and Goldberg, 1994). Vasan and Simonovic (2010) recently applied a differential evolutionary (DE) algorithm, which is an improved GA. The major difference between GA and DE is that GA relies on crossover, a mechanism of probabilistic exchange of information among solutions to create better solutions, while DE uses mutation as the primary search mechanism (Vasan and Simonovic, 2010). DE uses a uniform crossover that can take child vector parameters from one parent more often than from the other one. It is said that GA, most of the time, succeeds in finding the global optimum or at least arriving at somewhere very close to it. More importantly, GA is capable of handling discrete optimization (as pipe diameters are discrete; Savic and Walters, 1997).
Many other optimization algorithms have been used in the optimal design of water distribution systems (Tayfur, 2017). Loganathan et al. (1995) and Cunha and Sousa (1999) applied simulated annealing for the optimal design of water distribution systems. Geem et al. (2002) developed a harmony search optimization approach to solve network design problems, while Eusuff and Lansey (2003) developed the shuffled frog leaping algorithm. Maier et al. (2003) applied the ant colony optimization approach and improved GA both in terms of computational efficiency and its ability to find nearly optimal solutions. Baños et al. (2007) analyzed the performance of memetic algorithms for the optimal design of looped water distribution systems and demonstrated that it works well for problems of a large scale. Mohan and Babu (2009) proposed using a heuristic-based approach called a heuristics-based algorithm (HBA) to identify the lowest cost combination of pipe diameters. They demonstrated that the HBA is capable of identifying the lowest cost combination of pipe diameters with fewer numbers of evaluations. Moghaddam et al. (2018) applied a simple modified particle swarm optimization (SMPSO) to minimize the cost of water distribution networks. SMPSO then used a novel factor to decrease the inertia weight of the algorithm in proportion with simulation time to facilitate both global and local search. A literature review shows that stochastic models, particularly the GA types, give better results than linear and nonlinear optimization models (Pandit and Crittenden, 2012).
Objective function is important in optimizing the design of distribution systems. The main negative aspect of the single-objective constrained formulation is that it does not effectively set up a tradeoff between the cost and reliability/robustness of a design (Todini, 2000). Reliability can be considered as the ability to provide an adequate supply under both usual and unusual conditions (Farmani et al., 2005), including demand uncertainty, pipe failure, etc. One of the most used reliability criteria is the concept of resilience index, suggested by Todini (2000), which is a measure of the ability of the network to handle failures and is related indirectly to system reliability. Several suggestions were made to modify the resilience index introduced by Todini (2000; Farmani et al., 2005; Jayaram and Srinivasan, 2008; Prasad and Park, 2004; Raad et al., 2010; Reca et al., 2008; Baños et al., 2011; Greco et al., 2012; Pandit and Crittenden, 2012).
Subsequently, a genetic algorithm technique was used in this research as a part of GANetXL (Savić et al., 2011).
GANetXL was used as the optimization tool in this research. GANetXL has been developed by the Center for Water Systems at the University of Exeter as an addon in Microsoft Excel (Miri and Afshar, 2014; Peirovi et al., 2020). It is a common optimization tool with a spreadsheet-based interface for solving both single-objective and multi-objective optimization problems (Savić et al., 2011). The primary advantage of GANetXL is its capability for easy integration with EPANET via Visual Basic. GANetXL incorporates GA for single-objective and NSGA-II for multi-objective optimizations (Deb et al., 2002). In addition, it has the capability to apply penalty functions. GANetXL is well suited for solving multi-objective optimization problems (Mala-Jetmarova et al., 2014). There are a few applications of GANetXL in water systems, which include the development of a model for the optimal management of groundwater contamination (Farmani et al., 2009, 2005) and the multi-objective optimization of water distribution systems (Mala-Jetmarova et al., 2015; Piratla, 2016; Piratla and Ariaratnam, 2012). GANetXL was used to optimize two benchmark networks from the literature (two-loop and Hanoi water networks) in two different conditions, including single-objective (cost) and two-objective (cost and reliability criteria) optimizations. Afterwards, once the solutions were obtained, the performance of the proposed resilience index, network resilience, modified resilience index and minimum surplus head index was discussed. Finally, as the results obtained for the benchmark networks were satisfactory, GANetXL was used to design a real-life water network in Iran, where there are more hydraulic constraints compared to the benchmark networks. Thus, it is necessary to mention that quality issues were not addressed in this paper.
2.1 Optimization model for WDN design
In this paper, WDNs were optimized with pipe diameters as decision variables. Cost was considered as the objective function that must be minimized (Eq. 1), and the reliability criteria were modeled in the form of a two-objective function (Eq. 2).
where f1 is network cost, f2 is network reliability, ci is cost for unit length of pipe with diameter, Di length li, and N is pipe numbers in the network.
2.2 Constraints
The constraints to the optimization problem were as follows:
-
Explicit system constraints such as the conservation of mass of flow, conservation of energy, and conservation of mass of constituent, which all were controlled by water network simulator software, EPANET (Mala-Jetmarova et al., 2015; Rossman, 2000).
-
Implicit bound constraints, which include choosing pipe diameters from a commercially available set of discrete pipe sizes (Eq. 3), minimum and maximum pressure at load nodes (Eq. 4), and minimum and maximum velocity in the pipes (Eq. 5).
where Di is the diameter of pipe i, CDk is the kth commercially available pipe size, nc is the number of available pipe sizes, Hj is hydraulic head available at node j, is the minimum hydraulic head required at node j, is the maximum hydraulic head at node j, nd is the number of demand nodes, is the minimum velocity required at pipe i, is the maximum velocity at pipe i, and np is the number of pipes.
2.3 Reliability indicators
A range of reliability criteria has been introduced to different degrees of complexity. Usually, these criteria give some suggestion of the ability of a WDN to handle changing conditions and are straightforward to analyze, so they are practical for optimization studies that compare the performance of a network design. This section presents the definition of the key criteria and their derivatives and their advantages and disadvantages.
2.3.1 Resilience index (Ir)
Todini's (2000) resilience index is a popular surrogate measure within the WDN research field. It considers surplus hydraulic power as a proportion of available hydraulic power. The resilience index, Ir, is measured in the continuous range of [0–1] (for feasible solutions of ) and is formulated as follows (Todini, 2000):
where nn is the number of supply and demand nodes, nr is the set of supply nodes (reservoir/emptying tanks), np denotes the number of pumps, Hj is the available head at supply node j, represents the required head at supply node j, qj is the demand at node j, Qk is the supply at input node k, Hk is representative of the head associated with the input node k, Pi is the power of pump i, and, finally, γ is the specific weight of water. The maximization of the resilience index improves the ability of a pipeline network when encountering failure conditions.
2.3.2 Network resilience (In)
Prasad and Park (2004) introduced another reliability measure called network resilience (In), which incorporates the effects of both surplus power and reliable loops. Reliable loops can be ensured if the pipes connected to the same node do not vary greatly in diameter. If D1j, D2j, …, then Dnpj (where ) are the diameters of the np pipes connected to node j, and the uniformity of that node is given by Eq. (7), as follows:
where npj is the number of pipes connected to node j. The value of Cj is equal to 1 if the diameter of the pipes connected to the same node are the same, and Cj < 1 if the pipes connected to a node have different diameters. For nodes connected to only one pipe, the value of Cj is taken to be 1.
Theoretically, the value of the network resilience may vary between 0 and 1. However, for real-world systems, it never attains a value of 1, since imposing the same diameter to all pipes in a network need not always provide a Pareto optimal solution in cost-In space, as In is a measure of the combined effect of surplus power and nodal uniformity.
2.3.3 Modified resilience index (MRI)
Jayaram and Srinivasan (2008) proposed a modified resilience index (MRI), which theoretically overcomes the drawback of Todini's (2000) resilience index when evaluating networks with multiple sources. In contrast to Todini's (2000) resilience index, the value of the modified resilience index is directly proportional to the total surplus power at the demand nodes. Equation (9) describes MRI, which only considers the solutions with pressures equal to or higher than that required in all nodes. While Todini's (2000) Ir and Prasad's (2004) In take values up to a maximum of 1, the MRI of Jayaram and Srinivasan (2008) can be greater than 1 (Baños et al., 2011).
2.3.4 Minimum surplus head index (Im)
In a WDN, a minimum surplus head, Im, is defined as the lowest nodal pressure difference between the minimum required and observed pressure and is formulated as follows:
Maximization of the available surplus head at the most depressed node to some extent improves the reliability of a network (Prasad and Park, 2004).
2.4 GANetXL
In this paper, GANetXL was employed in the following two steps: it was used in the first step for a single-objective optimization based on GA and in the second step for two-objective optimization based on NSGA-II. GA and NSGA-II parameters such as population size, the number of generations, selection method, crossover and mutation operators, crossover and mutation probability, and the type of algorithm were tested, and reasonably well-performing parameters were selected for final optimization runs (see the Supplement).
In total, three example applications were studied: the two-loop (Alperovits and Shamir, 1977), Hanoi (Fujiwara and Khang, 1990), both of which were the benchmark networks, and a real-life case study in Iran.
3.1 Example 1: the two-loop network
The two-loop network was originally presented by Alperovits and Shamir (1977). The network consisted of seven nodes and eight pipes with two loops and was fed by gravity from a reservoir with a 210 m fixed head. The minimum pressure head requirement of the other nodes was 30 m above the nodal elevations.
In the first step, as a result of single-objective optimization of the two-loop network using GA technique in GANetXL, the minimum cost obtained was USD 419 000, with 35 000 number of function evaluations (NFEs), which was the same as the minimum costs obtained by GA (Savic and Walters, 1997), simulated annealing (SA; Cunha and Sousa, 1999), shuffled frog leaping algorithm (SFLA; Eusuff and Lansey, 2003), harmony search (HS; Geem, 2009), and scatter search (SS; Lin et al., 2007), with 250 000, 25 000, 11 323, 5000, and 3215 NFEs, respectively.
As a result, minimum cost was USD 419 000 for a one-objective optimization of this network, using GANetXL after 1000 generations that were equal to the minimum costs obtained by GA, SA, SFLA, HS, and SS.
In the second step, Fig. 1a–d show the obtained Pareto front for a two-objective optimization of two-loop network using NSGA-II in GANetXL, considering Ir, In, MRI, and Im as the second objective function, respectively. All of the solutions in this Pareto front were feasible (and all the network constraints are satisfied). As it is observed, the cost changes in the range of USD [0.424 × 10⁶–4.400 × 10⁶] and Ir, In, MRI, and Im criteria change in the ranges [0.338–0.903], [0.287–0.903], [0.040–0.107], and [0.122–12.856], respectively. The range of numbers presented was based on the minimum and maximum values of the solutions presented in the graphs. The lowest and the highest point on the Pareto front in each of the charts were the criteria for deriving the range of reliability indices and the cost range. In the cost range of USD [0.424 × 10⁶–1 × 10⁶], the cost-In Pareto front showed more and varied solutions in comparison to other graphs. However, with the increase in cost, non-dominated solutions decreased, and the current continuity in Pareto front disappears while cost-Ir (Fig. 1a) and cost-MRI (Fig. 1c) Pareto fronts had a better performance. In the cost-Im graph (Fig. 1d), the variety of obtained solutions in the lower and upper bound of Pareto front was lower than other graphs.
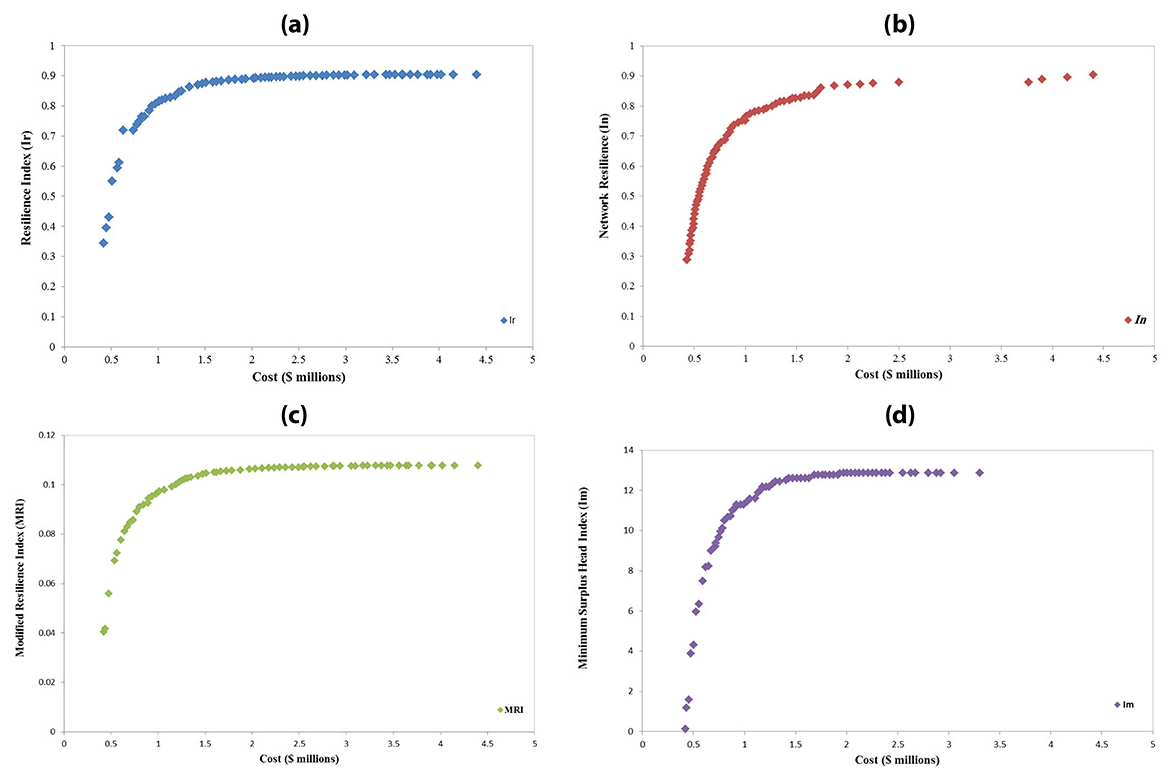
Figure 1Pareto front of two-objective function optimization of the two-loop network: (a) cost-Ir, (b) cost-In, (c) cost-MRI, (d) cost-Im.
Figure 2 shows the surplus pressure of the minimum pressure head requirement in the nodes of two-loop network for solutions with maximum reliability criteria and minimum cost. As observed, the surplus pressure of the nodes in the solutions with minimum cost was lower than the solutions of maximum reliability criteria (Ir, In, MRI, and Im). Also, with the design based on single-objective function (minimum cost), the surplus pressure was closer to the minimum allowed pressure in nodes 3, 6, and 7, showing that these nodes were the critical nodes of the network. As a result, if the two-loop network was designed only based on the minimum cost in critical periods such as pipe failures, then there would be problems or issues at these nodes.
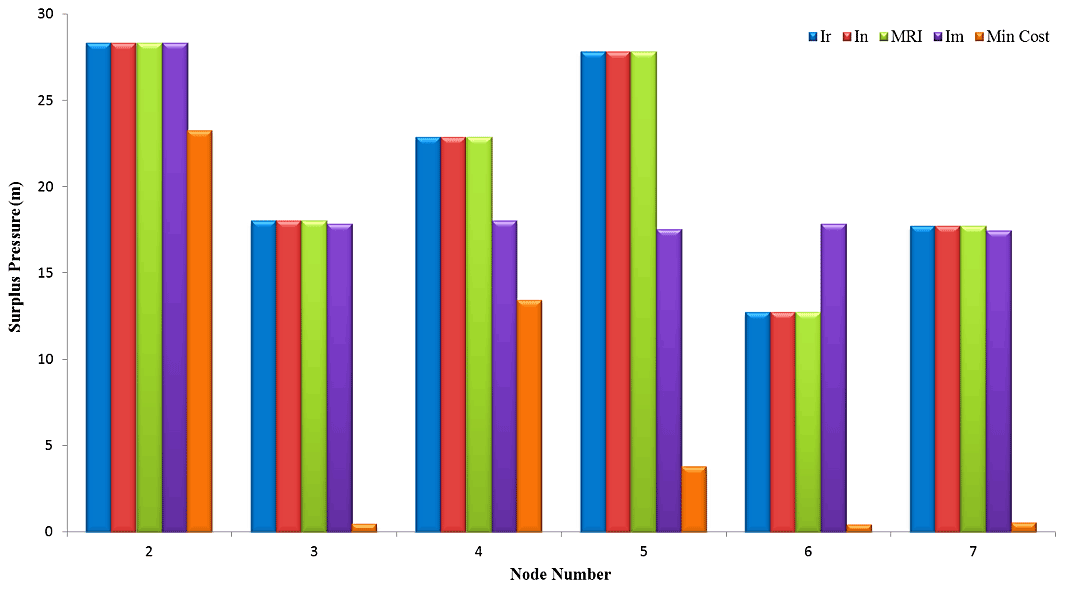
Figure 2Surplus pressure of nodes in the two-loop network for solutions of maximum reliability criteria and minimum cost.
The reliability evaluation should be analyzed under all feasible extreme conditions. Failure of multiple pipes and the failure of the reservoir connection line during a firefighting event and/or power or pumping station failures should be evaluated simultaneously. Although an infinite number of failure scenarios were likely, the probability of simultaneous failures in multiple pipes was too low (Tabesh et al., 2001). Pipe failure independency can be assumed (Su et al., 1987), and any likely dependency will be negative. For example, if a pipe failure occurs in the network, the pressure will decrease, and consequently, the probability of another pipe failure will decrease as well. However, in case the system is a large-scale WDN, the influence of pressure might not be significant. Other pipe failure reasons, such as damages or traffic loading, may lead to pipe failures that are completely independent events (Shafiqul Islam et al., 2013).
In this paper, to evaluate reliability of the candidate solutions of maximum Ir, In, MRI, and Im criteria, the nodal pressures were investigated under pipe failure conditions.
3.2 Example 2: the Hanoi network
The Hanoi network in Vietnam, first presented by Fujiwara and Khang (1990), was a new design, as all-new pipes were selected. The network consists of 32 nodes and 34 pipes organized in three loops. The system was gravity fed by a single reservoir. The network details are given in Fujiwara and Khang (1990). The minimum required pressure head for all nodes was 30 m, and the elevation for all nodes was zero. There were six available pipe diameters to be selected for each new pipe, and the pipe cost per meter for the six available pipe diameters had been listed in previous studies (Savić et al., 2011; Atiquzzaman and Liong, 2004; Zecchin et al., 2006; Pant and Snasel, 2021).
In the first step, as a result of single-objective optimization, the GA method in GANetXL obtained a minimum cost of USD 6.097 × 10⁶ with 100 000 NFEs for this network, while in previous research the methods of GA (Savic and Walters, 1997), ant colony optimization (ACO; Zecchin et al., 2006), and shuffled complex evolution (SCE; Atiquzzaman and Liong, 2004) reported costs of USD 6.195 million, USD 6.134 million, and USD 6.22 million, with 1 × 10⁶, 25 402, and 85 571 NFEs, respectively.
In the second step, Fig. 3a–d show non-dominated solutions of the Hanoi network which, when calculated by NSGA-II considering minimum cost versus maximum reliability criteria and all of the solutions in the Pareto front, was feasible. As observed in Fig. 4, the minimum values of Ir, In, MRI, and Im are 0.228, 0.256, 0.555, and 0.090, and the maximum values were 0.353, 0.353, 0.825, and 19.916, respectively. Cost values change in a range of USD [6.251 × 10⁶–10.791 × 10⁶] for cost-Ir and in USD [6.584 × 10⁶–10.969 × 10⁶] for the cost-In space, showing that the increase in cost-In to cost-Ir was due to the Cj factor in the formula (Eq. 8), which causes uniformity diameters in the design phase. In this example, the monotony and variety of represented solutions were observed in all Pareto fronts; the reason could be found in the increase in the network size and possible solutions for the network design.
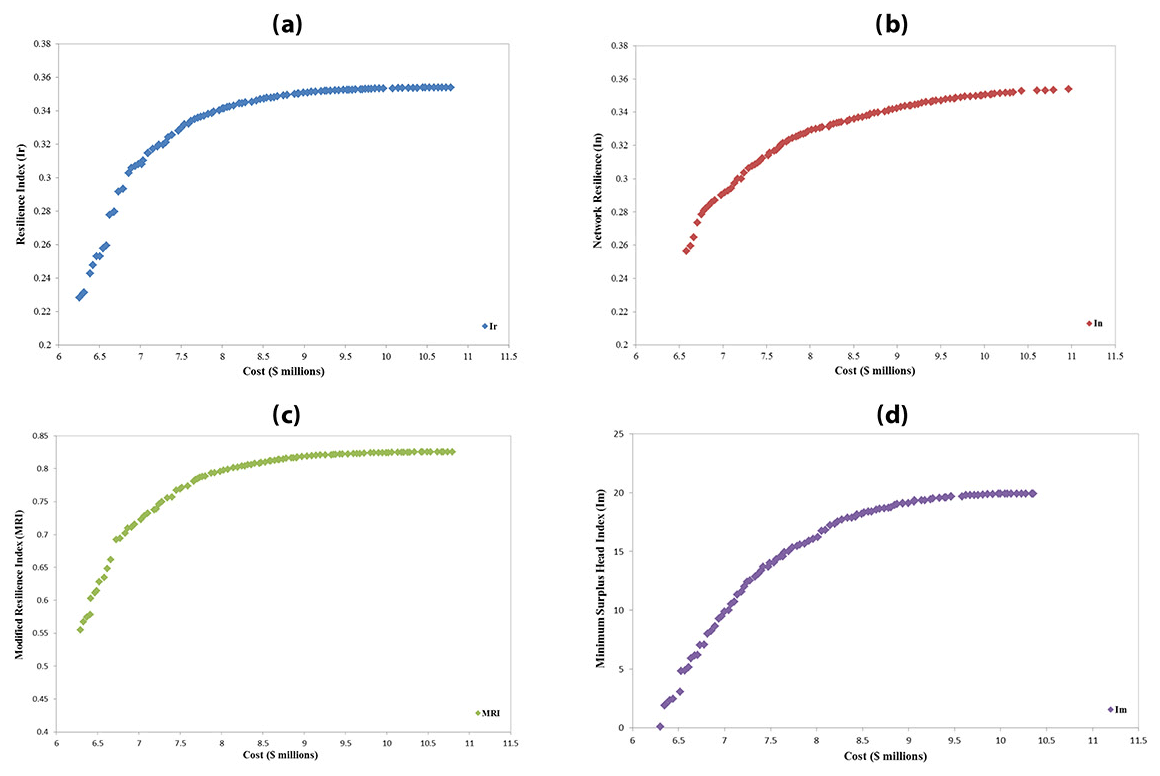
Figure 3Pareto front of two-objective function optimization of the Hanoi network: (a) cost-Ir, (b) cost-In, (c) cost-MRI, and (d) cost-Im.

Figure 4Nodal surplus pressure of Hanoi network for solutions of maximum reliability criteria and minimum cost.
Figure 5 shows the surplus pressure in comparison with the minimum allowed pressure in the nodes of the Hanoi network for solutions of the maximum reliability criteria and minimum cost. In the cost-based optimization, surplus pressure in node nos. 13, 30, and 31 was less than 1 m, which shows that these nodes were the most critical ones of this network. Ir, In, and MRI criteria have similar performance for all the nodes, but the Im criterion determines more surplus pressure for most of the nodes compared to other criteria in this network and unlike the two-loop network.
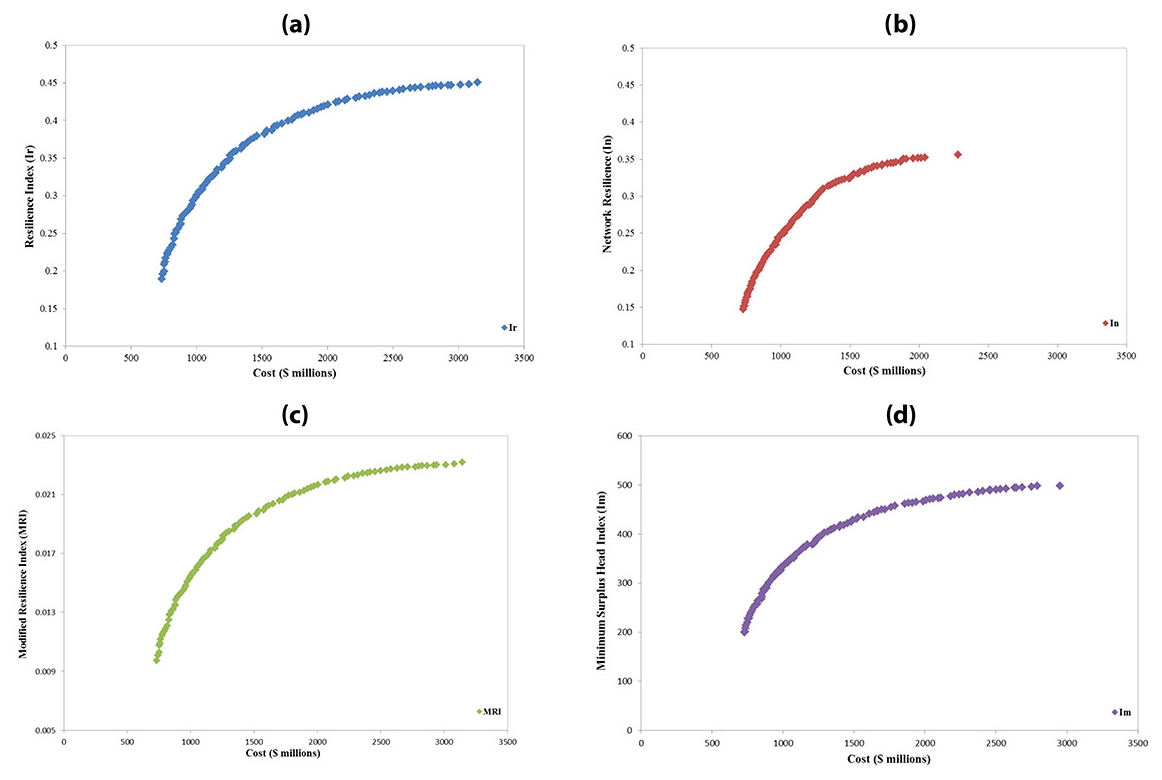
Figure 5Pareto front of the two-objective function optimization of the real-life network: (a) cost-Ir, (b) cost-In, (c) cost-MRI, and (d) cost-Im.
3.3 Example 3: the real-life network
The real-life WDN was located in Iran, and it had 37 pipes, 24 nodes, and a reservoir with a 962 m fixed head (Fig. 7). The design purpose of this network was municipal water supply to the city and improving the existing condition of the WDN (Moghaddam et al., 2020). For this purpose, a series of pipes which had diameters more than 100 mm were used for future conditions. For designing this network, polyethylene pipes (PE 80) with a Hazen–Williams coefficient of 130 were used. The nodes and pipes characteristics are presented in Moghaddam et al. (2020). In the design of the network, node pressure and velocity constraints were between 14–60 m and 0.2–2 m s−1, respectively (Department of Technical Affairs, Ministry of Energy, 2013). There were more constraints in this example than in the other ones.
In the first step, as a result of single-objective optimization using GA in GANetXL, the minimum cost was estimated at 7.54 × 10⁸ Rials with 100 000 NFEs, which shows a cost decrease of 46.14 % in comparison to the solution of the consultant company with 14×108 Rials (Rasekh et al., 2010).
In the second step, the results of Fig. 5a–d show that the Ir, MRI, and Im criteria had a better performance than the In criterion for this network in terms of non-dominated solutions. All three of these criteria had similar solutions of maximum and minimum cost in the Pareto front. All of the solutions in the Pareto front (Fig. 5) which were obtained by NSGA-II are feasible and satisfied the velocity and pressure constraints.
The results shown in Fig. 6 demonstrate that in the cost-based optimization, the surplus pressure in the node nos. 13 and 23 was less than 1 m, which explains that these nodes were the most critical ones in the network. Ir and MRI criteria had similar and more successful performance compared to Im in terms of the surplus pressure for all the nodes in the network. In had a smaller capability than other criteria to create surplus pressure in the network.

Figure 6Surplus pressure of the real-life WDN for solutions of maximum reliability criteria and minimum cost.
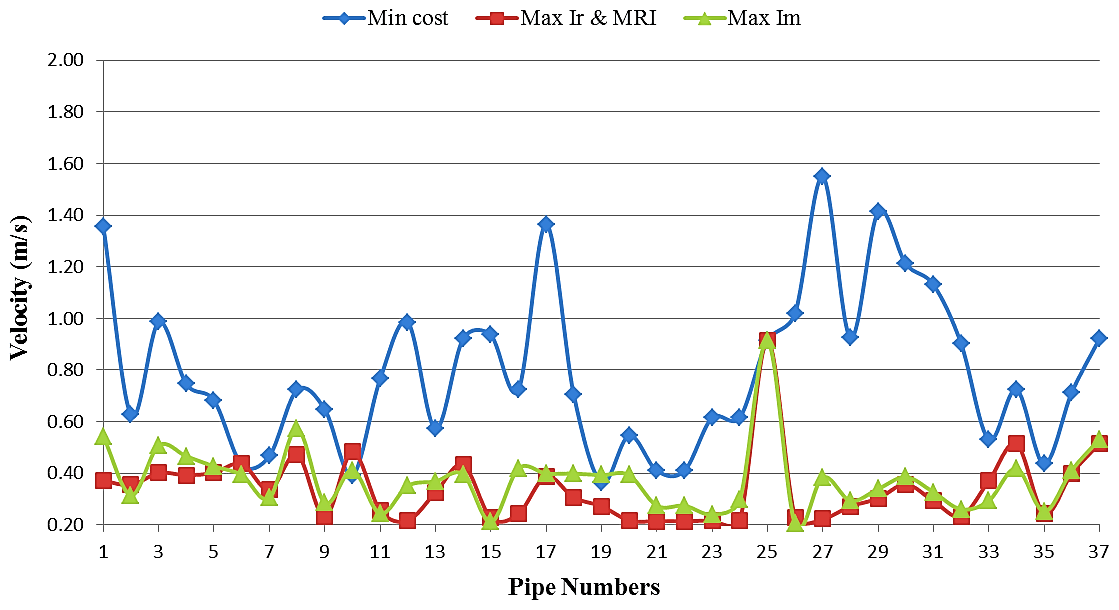
Figure 7Velocity variations in pipes for the solutions of minimum cost and maximum Ir, MRI, and Im criteria.
The results of the investigations in Fig. S4 (see the Supplement) show that only the failure in pipe no. 18 can influence the pressure nodes. Consequently, this pipe was one of the most sensitive pipes in this network. However, a reliability performance in the failure conditions was similar to the no-failure conditions in Fig. 7. Finally, for this network that includes a low diameter in existing pipes, In did not have a suitable performance because making the uniformity in the pipes connected to a node leads to a decrease in the diameter of new pipes. Thus, the capability of the surplus pressure decreased due to the increase in head loss in the pipes.
Figure 7 shows the velocity variations in the pipes for the solutions with minimum cost and maximum Ir, MRI, and Im criteria obtained using GA and NSGA-II in GANetXL. As observed, when the cost was the basis for the design and optimization of the real-life network, the velocity variation was high in the pipes. This can lead to some issues in the network. But in the presented solutions with maximum reliability criteria (Ir, MRI, and Im), velocity variations were not only low but almost uniform.
In this paper, the performance of a few reliability criteria was evaluated when applying them to two benchmark (two-loop and Hanoi) and one real-life (in Iran) networks. Both the existing pipes and hydraulic constraints were considered in the study in which GANetXL was used as the optimizer. The optimizations were performed, taking into account two different objective functions including a cost and reliability.
The results of the cost-oriented optimization showed that the solutions proposed by GANetXL for case study networks give solutions that were either less expensive than or as the same as the ones from the literature. In order to investigate the solutions with maximum values of Ir, In, MRI, and Im criteria and finding sensitive and important pipes with the most probability of failure in the network, a statistical analysis of single-objective optimization was used. The results showed that Ir, MRI, and Im criteria had a better performance than In under failure conditions, especially in real-life networks that include the existing pipes with a small diameter. If a WDN was only optimized based on cost, then it would be difficult to overcome losses in pipe failure conditions and pressure supply of nodes.
All data and models generated or used during this study are proprietary and confidential in nature.
The supplement related to this article is available online at: https://doi.org/10.5194/dwes-15-13-2022-supplement.
Conceptualization and data curation were done by AM, formal analysis and methodology carried out by AM, RPM, and HR, project administration was done by AF and RPM, and visualization and writing were prepared by ANZ, AM, and RPM.
The contact author has declared that neither they nor their co-authors have any competing interests.
Publisher’s note: Copernicus Publications remains neutral with regard to jurisdictional claims in published maps and institutional affiliations.
This paper was edited by Luuk Rietveld and reviewed by two anonymous referees.
Alperovits, E. and Shamir, U.: Design of optimal water distribution systems, Water Resour. Res., 13, 885–900, 1977.
Atiquzzaman, M. and Liong, S.-Y.: Using shuffled complex evolution to calibrate water distribution network model, J. Civil Eng. (IEB), 32, 111–119, 2004.
Baños, R., Gil, C., Agulleiro, J., and Reca, J.: A memetic algorithm for water distribution network design, in: Soft computing in industrial applications, Springer, 279–289, https://doi.org/10.1007/978-3-540-70706-6_26, 2007.
Baños, R., Reca, J., Martínez, J., Gil, C., and Márquez, A. L.: Resilience indexes for water distribution network design: a performance analysis under demand uncertainty, Water Resour. Manag., 25, 2351–2366, 2011.
Cunha, M. D. C. and Sousa, J.: Water distribution network design optimization: simulated annealing approach, J. Water Res. Pl.-ASCE, 125, 215–221, 1999.
Deb, K., Pratap, A., Agarwal, S., and Meyarivan, T.: A fast and elitist multiobjective genetic algorithm: NSGA-II, IEEE T. Evolut. Comput., 6, 182–197, 2002.
Department of Technical Affairs, Ministry of Energy: Design Criteria of Urban and Rural Water Supply and Distribution Systems, No. 117-3, Vice Presidency For Strategic Planning and Supervision, 2013.
Eslami, H., Esmaeili, A., Razaeian, M., Salari, M., Hosseini, A. N., Mobini, M., and Barani, A.: Potentially toxic metal concentration, spatial distribution, and health risk assessment in drinking groundwater resources of southeast Iran, Geosci. Front., 13, 101276, https://doi.org/10.1016/j.gsf.2021.101276, 2022.
Eusuff, M. M. and Lansey, K. E.: Optimization of water distribution network design using the shuffled frog leaping algorithm, J. Water Res. Plan. Man., 129, 210–225, 2003.
Farmani, R., Savic, D., and Walters, G.: Evolutionary multi-objective optimization in water distribution network design, Eng. Optimiz., 37, 167–183, 2005.
Farmani, R., Henriksen, H. J., and Savic, D.: An evolutionary Bayesian belief network methodology for optimum management of groundwater contamination, Environ. Modell. Softw., 24, 303–310, 2009.
Fujiwara, O. and Khang, D. B.: A two-phase decomposition method for optimal design of looped water distribution networks, Water Resour. Res., 26, 539–549, 1990.
Geem, Z. W.: Harmony search optimisation to the pump-included water distribution network design, Civ. Eng. Environ. Syst., 26, 211–221, 2009.
Geem, Z. W., Kim, J. H., and Loganathan, G.: Harmony search optimization: application to pipe network design, International Journal of Modelling and Simulation, 22, 125–133, 2002.
Greco, R., Di Nardo, A., and Santonastaso, G.: Resilience and entropy as indices of robustness of water distribution networks, J. Hydroinform., 14, 761–771, 2012.
Jacoby, S. L.: Design of optimal hydraulic networks, J. Hydr. Eng. Div.-ASCE, 94, 641–662, 1968.
Jayaram, N. and Srinivasan, K.: Performance-based optimal design and rehabilitation of water distribution networks using life cycle costing, Water Resour. Res., 44, W01417, https://doi.org/10.1029/2006WR005316, 2008.
Lansey, K. E. and Mays, L. W.: Optimization models for design of water distribution systems, in: Reliability Analysis of Water Distribution Systems. Part 1: State-of-the-Art, 37–84, 1989.
Lin, M.-D., Liu, Y.-H., Liu, G.-F., and Chu, C.-W.: Scatter search heuristic for least-cost design of water distribution networks, Eng. Optimiz., 39, 857–876, 2007.
Lippai, I., Heaney, J. P., and Laguna, M.: Robust water system design with commercial intelligent search optimizers, J. Comput. Civil Eng., 13, 135–143, 1999.
Liserra, T., Maglionico, M., Ciriello, V., and Di Federico, V.: Evaluation of reliability indicators for WDNs with demand-driven and pressure-driven models, Water Resour. Manag., 28, 1201–1217, 2014.
Loganathan, G., Greene, J., and Ahn, T.: Design heuristic for globally minimum cost water-distribution systems, J. Water Res. Plan. Man., 121, 182–192, 1995.
Maier, H. R., Simpson, A. R., Zecchin, A. C., Foong, W. K., Phang, K. Y., Seah, H. Y., and Tan, C. L.: Ant colony optimization for design of water distribution systems, J. Water Res. Plan. Man., 129, 200–209, 2003.
Mala-Jetmarova, H., Barton, A., and Bagirov, A.: Exploration of the trade-offs between water quality and pumping costs in optimal operation of regional multiquality water distribution systems, J. Water Res. Plan. Man., 141, 04014077, https://doi.org/10.1061/(ASCE)WR.1943-5452.0000472, 2014.
Mala-Jetmarova, H., Barton, A., and Bagirov, A.: Impact of water-quality conditions in source reservoirs on the optimal operation of a regional multiquality water-distribution system, J. Water Res. Plan. Man., 141, 04015013, https://doi.org/10.1061/(ASCE)WR.1943-5452.0000523, 2015.
Miri, S. M. and Afshar, A.: Optimum Layout for Sensors in Water Distribution Networks through Ant Colony Algorithm: A Dual Use Vision, Journal of Water and Wastewater, 25, 67–75, 2014 (in Persian).
Moghaddam, A., Alizadeh, A., Faridhosseini, A., Ziaei, A., and Heravi, D. F.: Optimal design of water distribution networks using simple modifed particle swarm optimization approach, Desalination and Water Treatment In press, 1–12, https://doi.org/10.5004/dwt.2018.21911, 2018.
Moghaddam, A., Alizadeh, A., Faridhosseini, A., Ziaei, A. N., Fallah Heravi, D., and Minaee, R. P.: Water distribution networks optimization using GA, SMPSO, and SHGAPSO algorithms based on engineering approach: a real case study, Desalin. Water Treat., 193, https://doi.org/10.5004/dwt.2020.25822, 2020.
Mohan, S. and Babu, K. J.: Water distribution network design using heuristics-based algorithm, J. Comput. Civil Eng., 23, 249–257, 2009.
Neelakantan, T., Suribabu, C., and Lingireddy, S.: Optimisation procedure for pipe-sizing with break-repair and replacement economics, Water SA, 34, 217–224, 2008.
Pandit, A. and Crittenden, J. C.: Index of network resilience (INR) for urban water distribution systems, International Journal of Critical Infrastructures, 12, 120–142, https://doi.org/10.1504/IJCIS.2016.075865, 2012.
Pant, M. and Snasel, V.: Design Optimization of Water Distribution Networks through a Novel Differential Evolution, IEEE Access, 9, 16133–16151, 2021.
Peirovi, R., Moghaddam, A., Miller, C., Moteallemi, A., Rouholamini, M., and Moghbeli, M.: Optimal Chlorination Station Scheduling in an Operating Water Distribution Network Using GANetXL, in: Frontiers in Water-Energy-Nexus – Nature-Based Solutions, Advanced Technologies and Best Practices for Environmental Sustainability, Springer, 337–340, https://doi.org/10.1007/978-3-030-13068-8_84, 2020.
Piratla, K. R.: Investigation of sustainable and resilient design alternatives for water distribution networks, Urban Water J., 13, 412–425, 2016.
Piratla, K. R. and Ariaratnam, S. T.: Reliability based optimal design of water distribution networks considering life cycle components, Urban Water J., 9, 305–316, 2012.
Prasad, T. D. and Park, N.-S.: Multiobjective genetic algorithms for design of water distribution networks, J. Water Res. Plan. Man., 130, 73–82, 2004.
Quindry, G. E., Liebman, J. C., and Brill, E. D.: Optimization of looped water distribution systems, J. Env. Eng. Div.-ASCE, 107, 665–679, 1981.
Raad, D., Sinske, A., and van Vuuren, J.: Multiobjective optimization for water distribution system design using a hyperheuristic, J. Water Res. Plan. Man., 136, 592–596, 2010.
Rasekh, A., Afshar, A., and Afshar, M. H.: Risk-cost optimization of hydraulic structures: methodology and case study, Water Resour. Manag., 24, 2833–2851, 2010.
Reca, J., Martinez, J., Banos, R., and Gil, C.: Optimal design of gravity-fed looped water distribution networks considering the resilience index, J. Water Res. Plan. Man., 134, 234–238, 2008.
Rossman, L. A.: EPANET 2: users manual, 1–200, https://epanet22.readthedocs.io/en/latest/ (last access: 23 July 2020), 2000.
Rouholamini, M., Wang, C., Miller, C. J., and Mohammadian, M.: A review of water/energy co-management opportunities, 2018 IEEE Power & Energy Society General Meeting (PESGM), Portland, OR, USA, 5–10 August 2018, 1–5, https://doi.org/10.1109/PESGM.2018.8586013, 2018.
Savic, D. A. and Walters, G. A.: Genetic algorithms for least-cost design of water distribution networks, J. Water Res. Plan. Man., 123, 67–77, 1997.
Savić, D. A., Bicik, J., and Morley, M. S.: A DSS generator for multiobjective optimisation of spreadsheet-based models, Environ. Modell. Softw., 26, 551–561, 2011.
Shafiqul Islam, M., Sadiq, R., Rodriguez, M. J., Najjaran, H., and Hoorfar, M.: Reliability assessment for water supply systems under uncertainties, J. Water Res. Plan. Man., 140, 468–479, 2013.
Simpson, A., Murphy, L., and Dandy, G.: Pipe network optimisation using genetic algorithms, American Society of Civil Engineers, Specialty Conference of Water Resources Planning and Management Division (1993: Seattle, Washington, USA), ISBN 0872629120, 1993.
Simpson, A. R. and Goldberg, D. E.: Pipeline optimization via genetic algorithms: From theory to practice, 2nd International Conference on Water Pipeline Systems, BHR Group Conference, Edinburgh, Scotland, UK, edited by: Miller, D. S., ISBN 0852989210, 309–320, 1994.
Simpson, A. R., Dandy, G. C., and Murphy, L. J.: Genetic algorithms compared to other techniques for pipe optimization, J. Water Resour. Plan. Man., 120, 423–443, 1994.
Su, Y.-C., Mays, L. W., Duan, N., and Lansey, K. E.: Reliability-based optimization model for water distribution systems, J. Hydraul. Eng., 113, 1539–1556, 1987.
Tabesh, M., Tanyimboh, T. T., and Burrows, R.: Extended period reliability analysis of water distribution systems based on head driven simulation method, Bridging the Gap: Meeting the World's Water and Environmental Resources Challenges, 1–11, https://doi.org/10.1061/40569(2001)385, 2001.
Tayfur, G.: Modern optimization methods in water resources planning, engineering and management, Water Resour. Manag., 31, 3205–3233, 2017.
Todini, E.: Looped water distribution networks design using a resilience index based heuristic approach, Urban Water, 2, 115–122, 2000.
Vasan, A. and Simonovic, S. P.: Optimization of water distribution network design using differential evolution, J. Water Res. Plan. Man., 136, 279–287, 2010.
Watanatada, T.: Least-cost design of water distribution systems, J. Hydraul. Eng,-ASCE, 99, 1497–1513, 1973.
Zecchin, A. C., Simpson, A. R., Maier, H. R., Leonard, M., Roberts, A. J., and Berrisford, M. J.: Application of two ant colony optimisation algorithms to water distribution system optimisation, Math. Comp. Model., 44, 451–468, 2006.