the Creative Commons Attribution 4.0 License.
the Creative Commons Attribution 4.0 License.
 | 29 Jan 2018
Optimum coagulant forecasting by modeling jar test experiments using ANNs
Sadaf Haghiri
Sina Moharramzadeh
Currently, the proper utilization of water treatment plants and optimizing their use is of particular importance. Coagulation and flocculation in water treatment are the common ways through which the use of coagulants leads to instability of particles and the formation of larger and heavier particles, resulting in improvement of sedimentation and filtration processes. Determination of the optimum dose of such a coagulant is of particular significance. A high dose, in addition to adding costs, can cause the sediment to remain in the filtrate, a dangerous condition according to the standards, while a sub-adequate dose of coagulants can result in the reducing the required quality and acceptable performance of the coagulation process. Although jar tests are used for testing coagulants, such experiments face many constraints with respect to evaluating the results produced by sudden changes in input water because of their significant costs, long time requirements, and complex relationships among the many factors (turbidity, temperature, pH, alkalinity, etc.) that can influence the efficiency of coagulant and test results. Modeling can be used to overcome these limitations; in this research study, an artificial neural network (ANN) multi-layer perceptron (MLP) with one hidden layer has been used for modeling the jar test to determine the dosage level of used coagulant in water treatment processes. The data contained in this research have been obtained from the drinking water treatment plant located in Ardabil province in Iran. To evaluate the performance of the model, the mean squared error (MSE) and correlation coefficient (R2) parameters have been used. The obtained values are within an acceptable range that demonstrates the high accuracy of the models with respect to the estimation of water-quality characteristics and the optimal dosages of coagulants; so using these models will allow operators to not only reduce costs and time taken to perform experimental jar tests but also to predict a proper dosage for coagulant amounts and to project the quality of the output water under real conditions.


Due to the rapid economic development as a result of population growth, the scarcity of water resources has been a serious issue for many decades. As a result, this has become a pressing issue in formulating sustainable development policies (Daghighi et al., 2017). Water treatment plant operations means decreasing the final price of the produced water in a way that achieves an optimum combination of efficiency and affectivity (Ng et al., 2016). The aim of this study is to understand the management of chemical substances to decrease the final cost of water, in which, for very similar inputs, the amount of coagulating chemicals required to decrease water turbidity is determined.
Water turbidity is one important and significant parameter when water treatment plants obtain their input water from natural resources like rivers or lakes (Nahvi et al., 2018). In a water treatment plant, water turbidity must be resolved along with water sterilization to ensure water clarity; otherwise the refined water is in no way usable for drinking purposes (Ndabigengesere et al., 1995). Materials called coagulants are used to decrease water turbidity, with the required amount depending on the environmental conditions (Nordmark et al., 2016) such as temperature, pH, the amount and type of turbidity, etc. The required amount is usually determined by performing an experiment called a jar test. Since these experiments are time-consuming and also have errors, they do not always provide a correct estimate of the optimum amount of coagulant, and they may increase the cost of chemicals used and diminish the management capability of the treatment plants to appropriately decrease the chemical requirements (Shamsnejati et al., 2015). Therefore, proposing new models for estimating the optimum amount of coagulant seems an appropriate way to alleviate costs and generally improve the health of drinking water (Lamrini et al., 2005).
Most particles that cause water to become opaque have the feature of hydrophobicity and are often settled by simple gravitational force as time passes, but there may be some smaller particles that cause water color such as hydro oxides (known as colloids) or acids such as humic acid and folic acid that are organic acids. These are all hydrophilic and tend to not settled. Bacteria are also colloidal particles and are not separated in the basic coagulation phase (Franceschi et al., 2002).
Modeling is an important math-based tool typically performed in one of the following ways:
-
numeric or deterministic methods
-
data-driven methods
Data-driven techniques have been receiving considerable attention in the field of process monitoring due to their easy implementation and less requirements for the underlying model (Yin et al., 2016). Deterministic data-driven methods are divided into classical statistical (multi-variable regression) and machine learning. Although conventional modeling has been used to describe biological procedures, it has been based on writing the equations for the speed of growth of the microorganisms, the consumption of the substrate, and the forming of the product, because microbiological reactions are non-linear and time dependent with a rather complicated nature, such models have many restrictions. The structure of data-driven models is often simpler than that of deterministic models and they provide a more general view of the nature of the issue that recognize the applicable relationships between the efficient parameters as a necessary part of the problem. Also, in gaining knowledge of the relationships between the parts of the model, a need arises for solving complicated equations, and in some situations the answers cannot be obtained under general conditions. Thus, numerical methods will not be used in this study. In the linear multiple-variable regression model, there are a great many assumptions, and using them all in practical problems causes issues. In performing research, because these assumptions represent complex statistical issues, they many be hidden from researchers' eyes and not taken seriously (Hornik, 1993). The proposed model would not have the required accuracy, so these types of models cannot be used in problems demanding high accuracy (Homada and Al-Ghusian, 1999).
Artificial neural networks (ANNs) are one of the machine learning methods used in many scientific fields today. An ANN is a machine learning method able to anticipate non-linear and complex relationships between inputs and outputs, and is often used to replace linear multiple-variable regressions. ANNs are a set of non-linear techniques that do not require the choice of a pre-determined mathematical model, because the relationships between input and output variables are automatically set by the utilized algorithm, so ANNs can be a good choice for solving those problems in which certain relationships between the variables are either not known or describing them would be difficult. The ANN was first proposed by McCulloch and Pitts in 1943 (McCulloch and Pitts, 1943) and ANNs have already been successfully used to model salinity, nutrient concentrations, air pollution, and algal growth (Maier and Dandy, 2001; Daghighi, 2017).
Despite using a very simple structure, its speed and the power of the calculation was strongly noted. The regular architecture of ANNs consist of three layers: the input layer (distributes the data sent into the network), the hidden layer (processes the data), and the output layer (extracts the results as per certain inputs). A network can have several hidden layers.
Theoretical tasks performed in the field have shown that a hidden layer for these models can approximate virtually any complicated and non-linear function (Maier and Dandy, 2005; Cybenko, 1989; Hornik et al., 1989), as proven by experimental and practical results (Homada and Al-Ghusian, 1999; Oliveira-Esquerre et al., 2002).
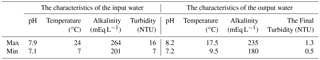
Table 1Ranges of available data. NTU represents nephelometric turbidity units.
Recent research studies show that determining statistical dimensions can enhance the capability and improve the performance of neural models (Maier and Dandy, 2000). Analyzing the main components is a technique for transforming the orthogonal components and if needed, for decreasing the number of dimensions of the variables, decreasing the number of variable dimensions used for correction, and improving the operation of the models developed in the ANN. This technique is a regular and practical method for data with several dimensions (Bui et al., 2016). The issue of recognizing the pattern which the data obeys – especially when there are more than two dimensions – is a very difficult task and the relationships usually cannot be graphically depicted. This method is for analyzing the problems in which several factors are important in the issue studied. The use of this technique makes things easier by making a model for simulating the biological refining process using an ANN. Research studies have shown that the simultaneous application of the techniques of combined analysis of the main components and the ANN produces better and more accurate results than the situation of considering them separately (Oliveira-Esquerre et al., 2002), so this study will use the same method (Zhang and Stanley, 1999; Baxter et al., 1999) by using the multi-layer perceptron (MLP) structure for the ANN for anticipating the turbidity and the color of the refined water at the Rossdale Water Treatment plant in Alberta, Canada. Gagnon et al. (1997) used the method of inverse models in ANNs, a similar method, for anticipating the necessary amount of alum for the Sainte-Foy Waste Water Treatment Plant in Quebec, Canada (Joo et al., 2000). Modeling has also been performed for the Chungju Wastewater Treatment Plant in Korea. Van Leeuwen prepared an ANN model based on the jar test procedure for use on the collected surface waters in southern Australia (Van Leeuwen et al., 1999). In the studies mentioned, because of the lack of proper output parameters, the ruling equations of the prepared models were not able to adapt themselves to output variable changes.
Zhang and Stanley (1999) added the refined water turbidity factor as an input parameter to the water characteristic parameters in their ANN for anticipating the optimum amount of alum for use in the Rossdale Water Treatment Plant. Yu did the same for the Taipei water treatment plant in Taiwan by applying a greater number of parameters, preparing his three ANN models for anticipating the proper amount of alum necessary for coagulation (Yu et al., 2000). According to the studied background, this method can be used for anticipating the proper amount of coagulant that in this research will be determined using the data from the Ardabil province drinking water treatment plant and for determining the available effective factors in the ANN, including the error percentage that can be passed up, the amount of experimental expenses, and the time needed for performing the jar test, all of which can be reduced by preparing the model and using the results.
Modeling by the use of ANNs reduces test time and cost, and decreases the necessity of performing experiments currently being performed in the drinking water treatment plant of Ardabil province. In addition, there is no need to know the type of input and output parameters or the quality of performing the process. By only providing the data to the program in numeric form, the determined answer is obtained along with all the effective factors on the process (which in this project are the temperature, pH, the degree of alkalinity, and the turbidity; according to the accessible data of the treatment plant). The factors are hidden in the data and the ANN has the capability to recognize complex and unknown systems. Thus, in this research, the following aims are being studied: to anticipate the optimum amount of coagulant, to analyze the collected data, to determine the best type of ANN for the purpose of modeling with the lowest error, to determine the optimum amount of coagulant in the process of coagulation and flocculation, and to validate the operation of the developed models.
Using this model would allow the operators of a water treatment plant to avoid time and cost wastage, and decrease the need to perform some of the experiments that are currently being performed in the drinking water treatment plant of Ardabil.
2.1 Data
The available data related to the drinking water treatment plant in Ardabil province have been collected over 2 years and the data ranges are presented in Table 1.
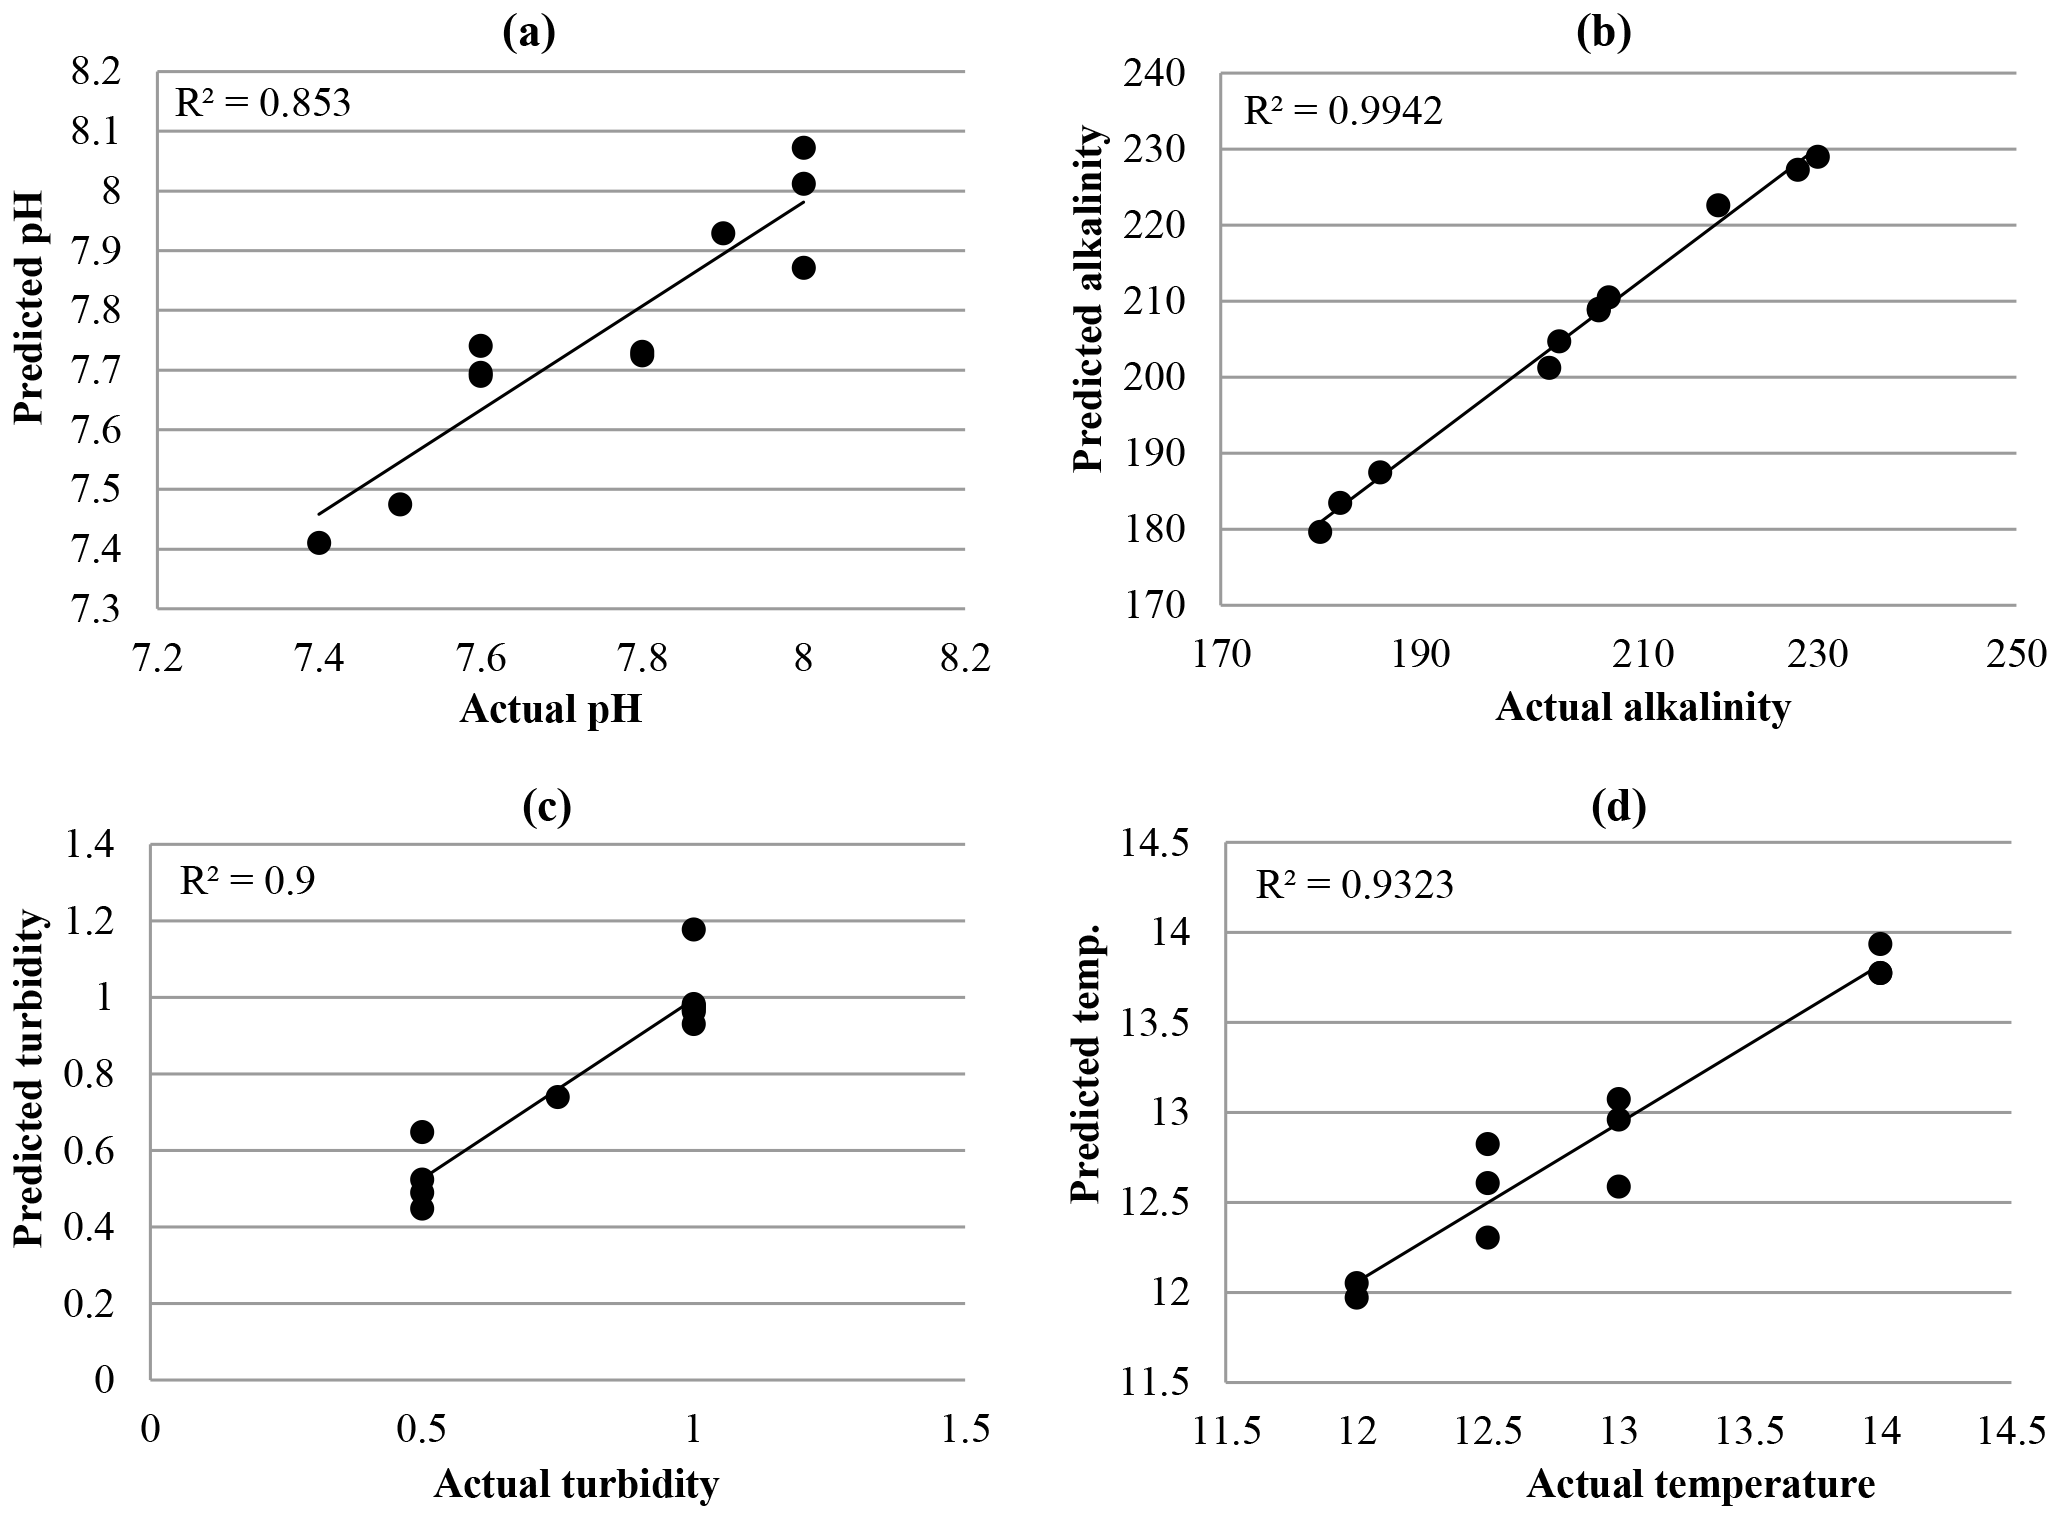
Figure 1Scatter plots of actual versus predicted values for the validation data obtained using model 1 (a) Actual pH, (b) Actual Alkalinity, (c) Actual Turbidity, and (d) Actual Temperature.
2.2 Data division and pre-processing
The 112 accessible information points have been categorized into three groups using the Bowden model (Bowden et al., 2002): (1) a training group for setting up the connection weights, (2) a testing group for knowing when to cease training and optimizing the structure of the ANN and the specifications of the internal model (for example, the rate of learning, the momentum), and (3) a validating group for testing the model's capability for generalizing the model for the range of information used for calibration. This method uses a self-organizing map (known as a SOM) for categorizing the high-dimensional input–output information in two-dimensional space (Kohonen, 1982). Then, information to be used for training, testing, and the validation have been chosen and, as a result, they contain values from each group. This act makes sure that all three groups of information have all the data patterns and so properly represent the statistics of the population. Clustering the information into the groups of testing and training makes sure that over-fitting will not happen and that the data used for validation will not be used for developing the model in any capacity.
The use of this method has resulted in 80, 10, and 10 % of points in the training, testing, and validation, respectively.
For data standardization and also to increase the accuracy and decrease the error (in both prepared models), all data were normalized before being entered into the model using the normal distribution function:
in which x is the primary amount, is the average of the data, and SD is the standard deviation.
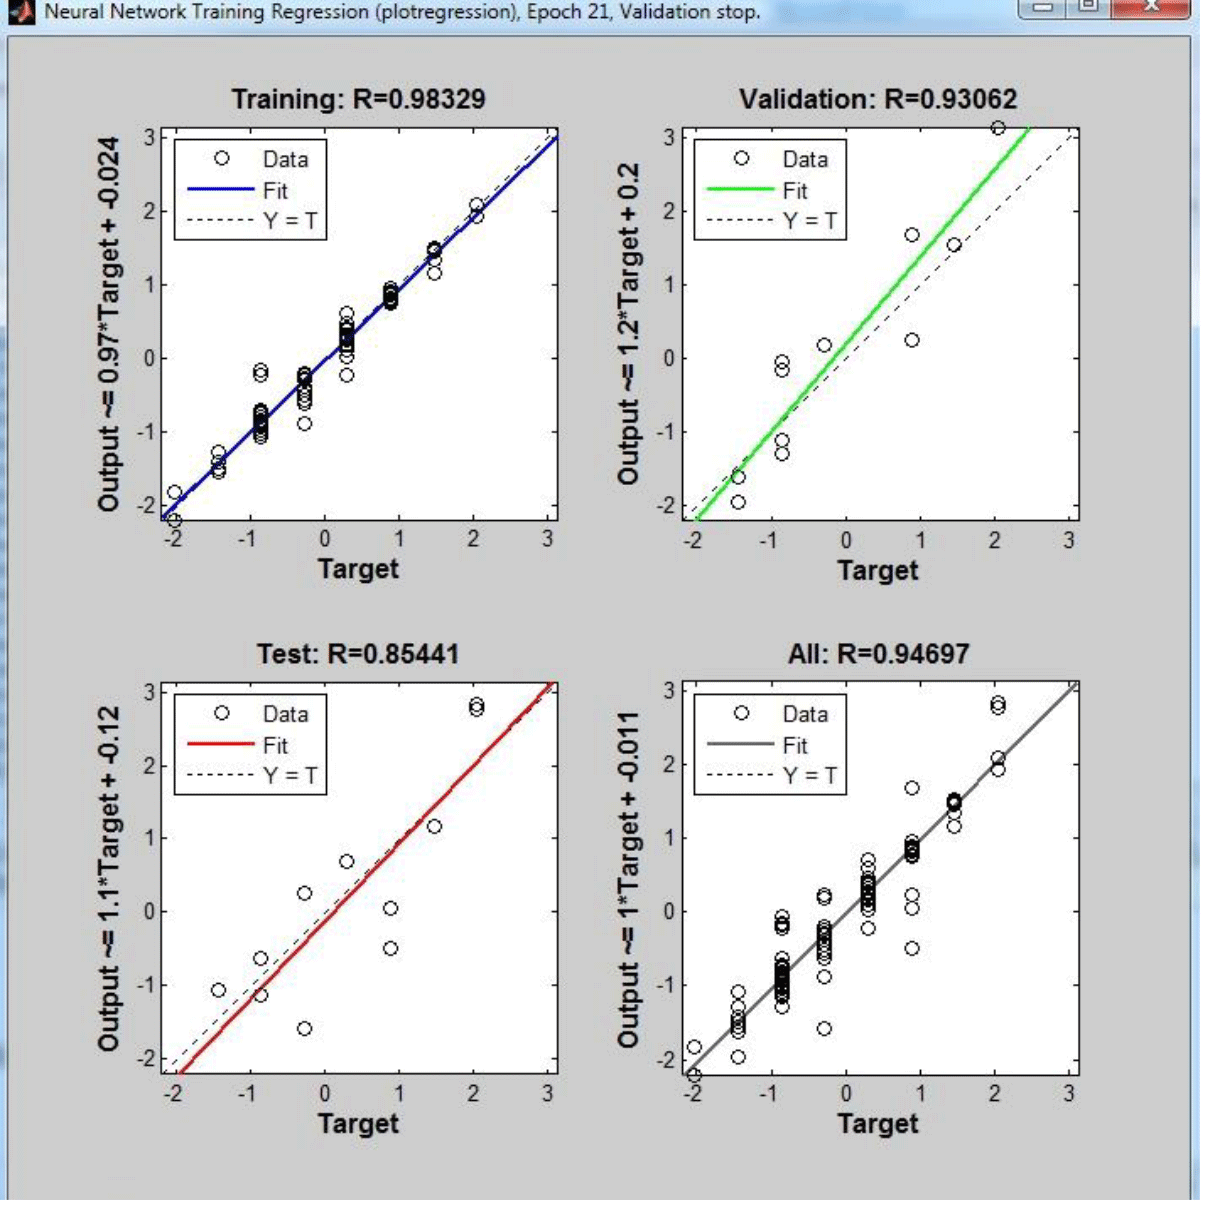
Figure 2Comparing the coagulant dose real data with predicted data in 3 steps and in form of general.
2.3 Choice of model inputs
2.3.1 Model 1 – prediction of treated water-quality parameters
The model for anticipating the quality of the output water was first prepared. In this model, after normalizing the input data (turbidity, alkalinity, temperature, and pH), an MLP ANN with one hidden layer and 15 neurons (produced by trial and error) was used in the MATLAB ANN toolbox. In this model, the data related to the pure input water (turbidity, alkalinity, temperature, and pH), the amount of coagulant, the model inputs, and the quality of the output water (turbidity, temperature, alkalinity, and pH) have been included. Categorizing variables for using them in an ANN can be performed in many different ways. To determine the end time of the training period and compare the generalization capability of different models, parallel validation, a method often used in ANN models, is used. In the parallel validation, a separate group of data is used for experimentally examining the ability of different models to generalize with respect to the different levels of training. Since data for this separate group must not be in the training or validation groups, the data are randomly categorized into three groups. The group related to network training (about 80 % of all input data), through which network weights are determined; the group monitoring network training (about 10 % of all data), through which the network error is studied to retrain the network with respect to end time calculations to make a decision; and the validation group (also about 10 % of all data) that studies the capability of the network after its training. Training occurs up to the time at which the error related to the monitoring data group decreases, at which point the training is stopped. By using this method, also called the stop training algorithm, use of more complicated architectures in designing the network is provided to the operator without having any over-fitting problem, and by using some of the factors happening while the problem is in the network. The standards mentioned play an important role in this method (Standard Methods, 1998). Figure. 1a–d are related to the data validation that have been prepared by calculating the error of the model and analyzing the amount of difference between the real data and the anticipated data reached using 10 % of the data.

2.3.2 Model 2 – prediction of optimal dose (process inverse model)
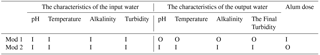
Model 2, representing the goal of this research, anticipates the amount of necessary coagulant according to the input characteristics of the input water and the desired standard water characteristics. In this model, after normalizing the input data, an MLP ANN with one hidden layer and 16 neurons (produced by trial and errors) was used. In this part, according to the real inputs taken from the water treatment plant, the final model was built, and the necessary pure input water and the output water characteristics are given to the model, with the amount of the necessary coagulant is given as the output. Table 2 demonstrates the inputs of both models.
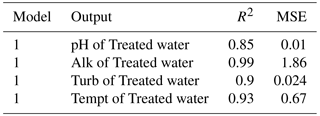
The results produced by using Model 1 (related to pH, alkalinity, temperature, and turbidity) are shown in Fig. 1a–d, with the related R2 and mean squared error (MSE) shown in Table 3 for the 112 data points. The model has accomplished reasonable accuracy in predicting all three parameters of the treated water quality, the R2 values from 0.94 for anticipating the amount of alkalinity and 0.85 for anticipating the pH. The mean square errors for the prediction of turbidity (measured in nephelometric turbidity units, NTU) are also relatively small (errors of 0.011 NTU, 0.01 pH, 0.67 ∘C and 26.31 mg L−1).
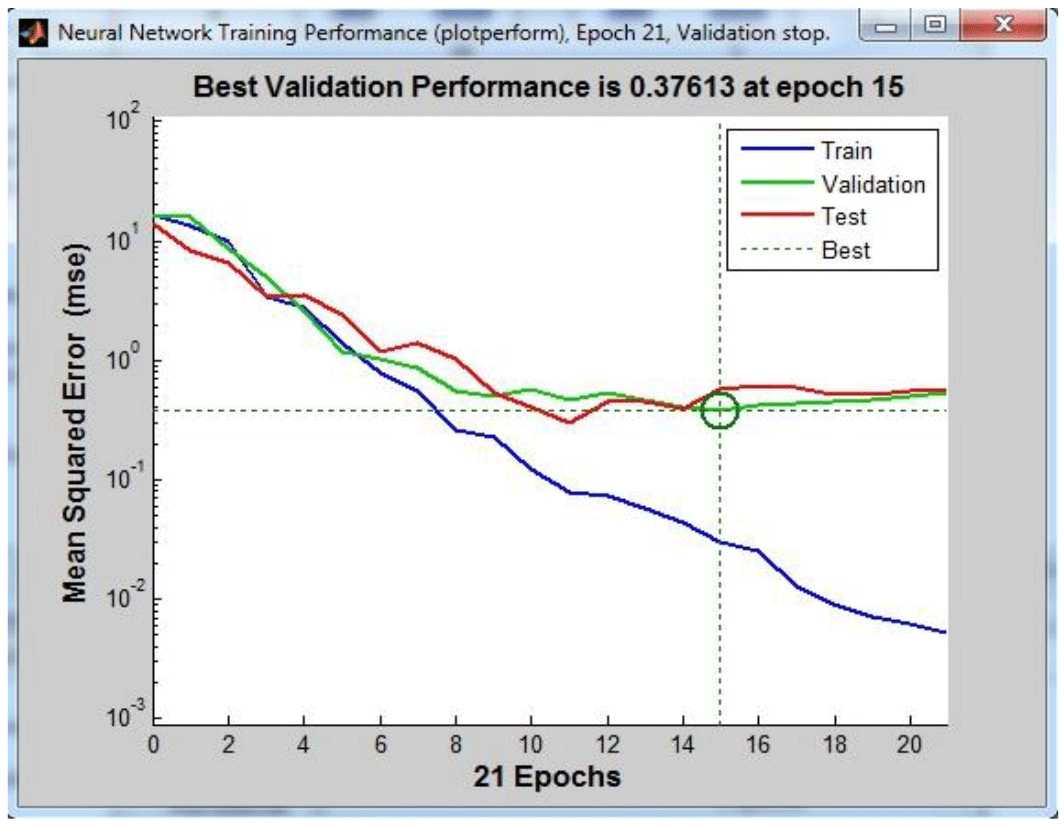
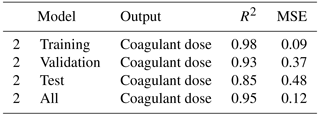
In model 2, The results of the optimum coagulant dose obtained, by using model 2, are shown in Figs. 2 and 3, with the corresponding amounts of R2 and MSE shown in Table 4. The model has also achieved reasonable accuracy in predicting the amount of the residual aluminum of the treated water with an R2 of 0.93 and a MSE of 0.37 mg L−1.
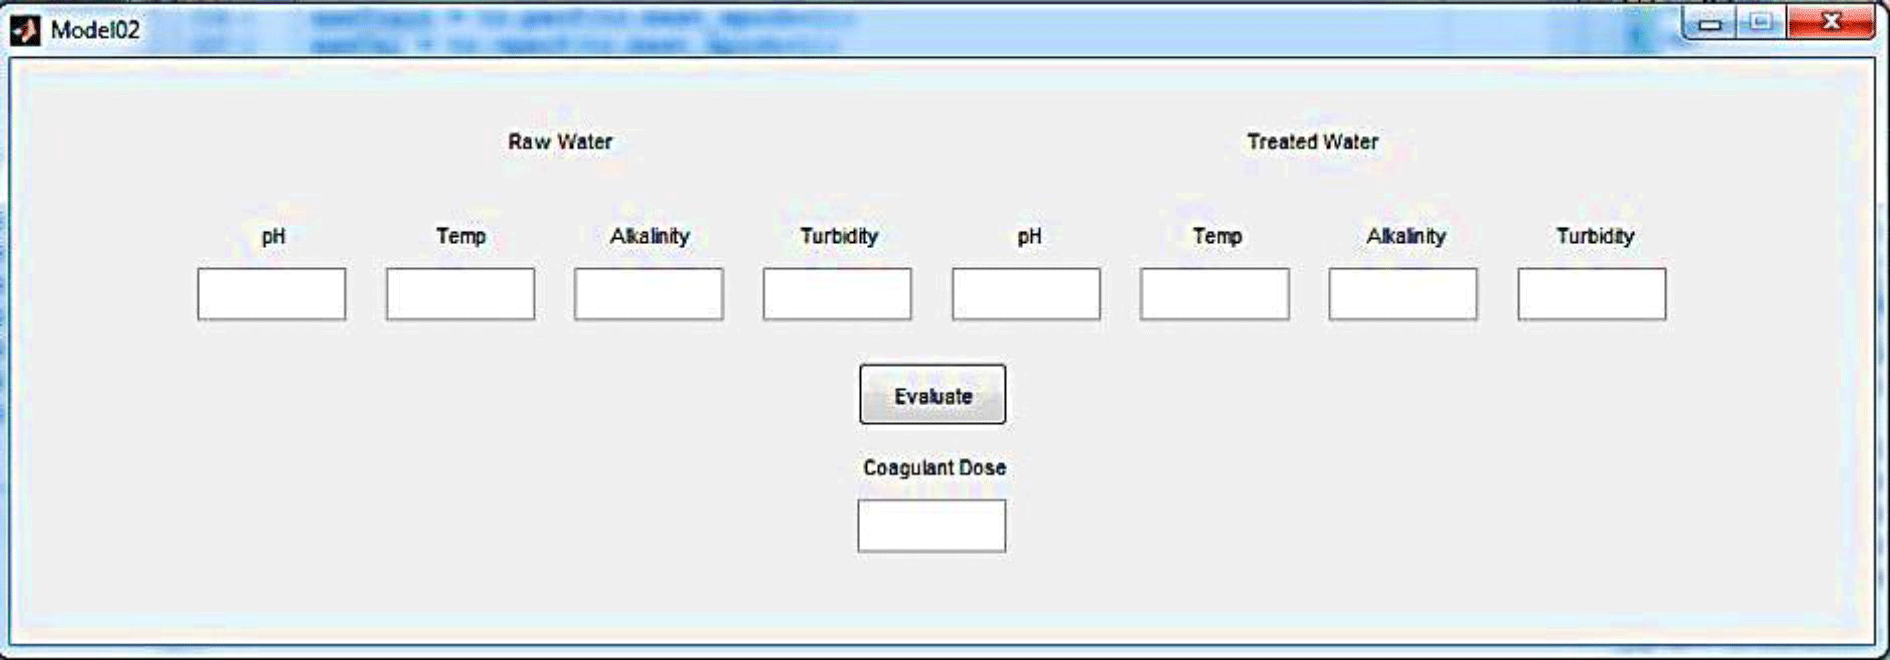
Finally, a user-friendly model has been prepared for use by the operator. The prepared software is a graphical user interface (GUI) generated by the MATLAB software. Figure 4 illustrates how the operator can observe the results related to output water quality by entering the input water data and the amount of coagulant in Model 1.
Also for Model 2, another user-friendly GUI was programmed containing various parameters such as pH, alkalinity, temperature, and turbidity for both raw and treated water. After having all input data, the optimum coagulant dosage result is given, as shown in Fig. 5.
In this research, the simulation of the jar experiment in the flocculation and coagulation unit at the Ardabil province drinking water treatment plant have been studied using, for the first time, an ANN of type MLP. Using this method, two models were created to enable presentation of water-quality characteristics after coagulation and flocculation and anticipating the optimum amount of the coagulant related to changing characteristics of the input water in the minimum possible time and by the highest accuracy.
By choosing effective parameters in the jar test, some parameters such as the color and hydraulic parameters like the clarifier overflow rate have been taken into consideration, in addition to the parameters considered in this research (temperature, pH, turbidity, and the amount of coagulant). As in previous studies (because of not measuring the number of parameters listed and not recording related data, and also because of the relatively small effect they have in comparison to the considered parameters), we were not able to apply their effects. Of course the considered parameters are among the most important effective parameters and because extending all the effective parameters in a single experiment was not feasible, it is possible to consider the prepared model for the results of this experiment as a good approximation.
Because the ANN model is a parametric method, if the amount of recorded data is increased, the model accuracy will increase. In this study, there were 112 recorded data points used over a 2-year period, that included data related to the input (pure) water, the output water, and the proper amount of coagulant. Because of the absence of high rate changes among the data and the absence of outlier data, there was no need to prepare, analyze, and select the data. Since the used components have different units and dimensions, they cannot be compared in terms of average and standard deviation, so they have been normalized. The training of the model has performed well according to analysis of existing errors, so the most prominent and the only weak point is access to only a small amount of recorded data.
One notable suggestion for continuation of the study would be utilization of other modeling methods, especially other types of ANNs, and also the utilization of the resources with a greater amount of recorded data related to the jar experiment.
All data are available on the website of Ardabil's Water and Waste Water Company (2018). All data are publicly accessible and are reported in the Persian language in separate tables for all years since 1 January 1991.
The authors declare that they have no conflict of interest.
Great thanks to Naser Mehrdadi, Water Institute of
the University of Tehran. This study was supported by the Daneshkar Ahwaz Company.
Edited by: Ran Shang
Reviewed by: Stephen Mounce and two anonymous referees
Ardabil's Water and Waste Water Company: The characteristics of the input and output water, available at: http://www.abfa-ardabil.co.ir/HomePage.aspx?lang=en-US&site=DouranPortal&tabid=1, last access: 24 January 2018.
Baxter, C. W., Stanley, S. J., and Zhang, Q.: Development of a full scale artificial neural network model for the removal of natural organic matter by enhanced coagulation, Aqua, 48, 129–136, 1999.
Bowden, G. J., Maier, H. R., and Dandy, G. G.: Optimal division of data for neural network models in water resources applications, Water Resour. Res., 38, 2-1–2-11, 2002.
Bui, H. M., Perng, Y. S., and Duong, H. G. T.: The use of artificial neural network for modeling coagulation of reactive dye wastewater using Cassia fistula Linn. (CF) gum, J. Environ. Sci. Manag., 19, 1–8, 2016.
Cybenko, G.: Approximation by Superpositions of a Sigmoidal Function Math, Control Signals Systems, 2, 303–314, 1989.
Daghighi, A.: Harmful Algae Bloom Prediction Model for Western Lake Erie Using Stepwise Multiple Regression and Genetic Programming, Electronic Thesis, available at: https://etd.ohiolink.edu/ (last access: 24 January 2018), 2017.
Daghighi, A., Nahvi, A., and Kim, U.: Optimal Cultivation Pattern to Increase Revenue and Reduce Water Use: Application of Linear Programming to Arjan Plain in Fars Province, Agriculture, 7, 73, https://doi.org/10.3390/agriculture7090073, 2017.
Franceschi, M., Girou, A., Carro-Diaz, A., Maurette, M., and Puech-Costes, E.: Optimization of the coagulation-flocculation process of raw water by optimal design method, Water Res., 36, 3561–3572, 2002.
Gagnon, C., Grandjean, B. P. A., and Thibault, J.: Modelling of coagulant dosage in a water treatment plant, Artif. Intell. Eng., 11, 401–404, 1997.
Homada, M. F. and Al-Ghusian, I. A.: Integrated Wastewater Treatment Plant Performance Evaluation Using Artificial Neural Networks, Water. Sci. Tech., 40, 55–65, 1999.
Hornik, K.: Some new results on neural network approximation, Neural Networks, 6, 1069–1072, 1993.
Hornik, K., Stinchcombe, M., and White, H.: Multilayer feed forward networks are universal approximators, Neural Networks, 2, 359–366, 1989.
Joo, D. S., Choi, D. J., and Park, H.: The effects of data preprocessing in the determination of coagulant dosing rate, Water Res., 34, 3295–3302, 2000.
Kohonen, T.: Self-organized formation of topologically correct feature maps, Biol. Cybern., 43, 59–69, 1982.
Lamrini, B., Benhammou, A., Karama, A., and Le-Lann, M.: Drinking water treatment: a neural network Model for coagulation dosing, Adaptive an natural computing algorithms, 96–99, available at: http://scholar.googleusercontent.com/scholar?q=cache:ZkCaWuaybpkJ:scholar.google.com/+DRINKING+WATER+TREATMENT:+A+NEURAL+NETWORK+MODEL+FOR+COAGULATION+DOSING+DOI&hl=en&as_sdt=0,44&as_vis=1 (last access: 24 January 2018), 2005.
Maier, H. R. and Dandy, G. C.: Neural networks for the prediction and forecasting of water resources variables: a review of modeling issues and applications, Environ. Modell. Softw., 15, 101–124, 2000.
Maier, H. R. and Dandy, G. C.: Neural network based modelling of environmental variables: a systematic approach, Math. Comput. Model., 33, 669–682, 2001.
Maier, H. R. and Dandy, G. C.: Input determination for neural network models in water resources applications, J. Hydrol., 301, 75–92, 2005.
McCulloch, W. S. and Pitts, W.: A logical calculus of the ideas immanent in nervous activity, B. Math. Biophys., 5, 115–133, 1943.
Nahvi, A., Daghighi, A., and Nazif, S.: The Environmental Impact Assessment of Drainage Systems: A Case Study of the Karun River Sugarcane Development Project, Arch. Agron. Soil Sci., 64, 185–195, https://doi.org/10.1080/03650340.2017.1340641, 2018.
Ndabigengesere, A., Narasiah, K. S., and Talbot, B. G.: Active agents and mechanism of coagulation of turbid waters using Moringa oleifera, Water Res., 29, 703–710, 1995.
Ng, F., Harding, J. A., and Glass, J.: An eco-approach to optimise efficiency and productivity of a hydraulic excavator, J. Clean. Prod., 112, 3966–3976, 2016.
Nordmark, B. A., Przybycien, T. M., and Tilton, R. D.: Comparative coagulation performance study of Moringa oleifera cationic protein fractions with varying water hardness, J. Environ. Chem. Eng., 4, 4690–4698, 2016.
Oliveira-Esquerre, K. P., Mori, M., and Bruns, R. E.: Simulation of an Industrial Wastewater Treatment Plant Using Artificial Neural Networks and Principal Components Analysis, Braz. J. Chem. Eng., 19, 365–370, 2002.
Shamsnejati, S., Chaibakhsh, N., Pendashteh, A. R., and Hayeripour, S.: Mucilaginous seed of Ocimum basilicum as a natural coagulant for textile wastewater treatment, Ind. Crop. Prod., 69, 40–47, 2015.
Standard Methods: Standard Methods for the Examination of Water and Waste Water, 20th ed., Method 4500-CL, American Public Health Association, Washington, USA, 1998.
Van Leeuwen, J., Chow, C. W. K., Bursill, D., and Drikas, M.: Empirical mathematical models and artificial neural networks for the determination of alum doses for treatment of southern Australian surface waters, Aqua, 48, 115–127, 1999.
Yin, S., Wang, G., and Gao, H.: Data-driven process monitoring based on modified orthogonal projections to latent structures, IEEE T. Contr. Syst. T., 24, 1480–1487, 2016.
Yu, R. F., Kang, S. F., Liaw, S. L., and Chen, M. C.: Application of artificial neural network to control the coagulant dosing in water treatment plant, Water Sci. Technol., 42, 403–408, 2000.
Zhang, Q. and Stanley, S. J.: Real-time water treatment process control with artificial neural networks, J. Environ. Eng., 125, 153–160, 1999.