the Creative Commons Attribution 4.0 License.
the Creative Commons Attribution 4.0 License.
 | 11 Feb 2021
Evaluation of changes in some physico-chemical properties of bottled water exposed to sunlight in Bauchi State, Nigeria
Rose E. Daffi
Fwangmun B. Wamyil
It is common for bottled water and other assorted drinks to be seen displayed outside stores and in the sun in most parts of Nigeria. The country is mostly hot year-round, and over the course of the year, temperatures can rise to as high as 40 ∘C around March–April in the study area. The leaching effect of chemicals from polyethylene terephthalate (PET) bottled water was investigated for five commercially available bottled water brands. Temperature, pH, antimony, bisphenol A (BPA), and nitrate levels were measured on days 0, 14, and 28 for control samples and samples exposed to direct sunlight, using destructive sampling technique. Antimony was not detected in brands A, B, and E in the baseline measurement at day 0, while brands C and D had low values; after 28 d all the control samples still had antimony levels within the United States Environmental Protection Agency (US EPA) standard. Meanwhile, all the samples exposed to sunlight exceeded US EPA standard levels at 14 and 28 d, except brand A which was within limit at 14 d with value of 4.59 µg L−1. All control and exposed samples were below the European Union Drinking Water Directive (EU DWD) total daily intake (TDI) of BPA (0.05 mg per kilogram of body weight)−1 d−1. Values obtained for nitrate showed that all control samples did not exceed the US EPA guideline level for nitrates in drinking water for days 0, 14, and 28, while three of the samples, i.e. brands C, D, and E, exceeded the guideline level at day 28. Exposure of bottled water to sunlight was seen to impair the quality of the water for consumption.


Bottled water is classified as a consumer food product and consists of spring, purified, mineral, sparkling, artesian, or well water which is carefully processed to meet regulatory standards (IBWA, 2020).
Historical records show that the introduction of the sale of bottled water began in the 17th century in the United Kingdom (Holy Well bottling plant), when water from mineral springs were thought to possess therapeutic and healing properties and sold as remedies for ailments (Malvern Beacon, 2020; Mitte Team, 2019). When Johann Jacob Schweppe discovered how to carbonate water in 1783, the fizzy quality of plain water gave considerable competition to mineral water (Mitte Team, 2019; Schweppes-Heritage, 2020). The lowering cost of glass and new techniques of bottling increased the popularity of bottled water and carbonated drinks in the United States in the 19th century. Sales were common up until the early part of the 20th century, when chlorination was discovered to make tap water safer, causing a decline in the choice of bottled water (Hurly, 2016; National Center for Environmental Health et al., 1999).
The introduction of polyethylene terephthalate (PET) as a replacement for glass in the 1970–1980s caused a reduction in the cost of manufacturing bottled drinks (including water; Leigh, 2011; Mitte Team, 2019; Parker, 2019). PET is a clear, strong, and lightweight plastic (thermoplastic polyester resin) used in producing packaging materials for food, beverages, cosmetics, water, photographic film, and in making apparel (International Life Sciences Institute, 2000; PETRA, 2015; US EPA, 1995). PET was first synthesised in the 1940s by DuPont chemists (PETRA, 2015). The processing of PET involves mixtures of ethylene glycol (EG) and terephthalic acid (TPA) or dimethyl terephthalate (DMT) to form a chain of polymers. The output is extruded, cooled, and cut into small pellets, and the pellets are moulded into any shape by heating them into a molten liquid (PETRA, 2015; US EPA, 1995). PET bottles can be recycled by breaking them down into their constituents and using same to make new PET materials, otherwise they become a nuisance and an environmental hazard when improperly disposed of (PETRA, 2015; US EPA, 1995).
Drinking water quality is a major risk factor for diseases, and established standards ascertain the suitability of water for intended use. These standards can be broadly categorised as physical, chemical, biological, and radiological (Davis, 2010; Gaur, 2008; Spellman, 2003).
The physical properties of water are colour, turbidity, temperature, taste, and odour. The chemical properties of water are pH or the presence of chemicals like arsenic, iron, lead, sodium, zinc, or other toxic organic or inorganic substances. Some chemicals are essential to humans and animals in trace amounts, but prolonged exposure in higher amounts can be dangerous to human health. Some chemicals can occur naturally in the water source, whereas others are as a result of human activities (industrial mining and human dwellings), agricultural activities (fertiliser and pesticide application), water treatment (supply lines and coagulants), pesticides (public health use), or vessels in which water is stored (plastic bottles; WHO, 2017). Regulations specifically aim at ensuring that the deleterious effects of the chemicals are avoided. Other chemicals like antimony, bisphenol A (BPA), and nitrates can be present in drinking water, as a result of plastic bottle feeding of infants, and other plastics, including bottled drinking water (US EPA, 2010; WHO, 2017). For example, antimony found in antimony trioxide is used as a flame retardant or in polycondensation when PET is produced (Bach et al., 2014; WHO, 2003a).
Radiological standards deal with water that is in contact with radioactivity. Parameters like alpha particles, beta particles, radium-226 and 228, and uranium have standards set for drinking water to ensure that there are no untoward health effects to human wellbeing when consumed (Davis, 2010). Radiation occurs naturally (accounting for almost 80 % of the dose from all radiation sources), from medical diagnosis (accounts for 19.6 %), and from artificial sources (accounts for 0.4 %; WHO, 2017).
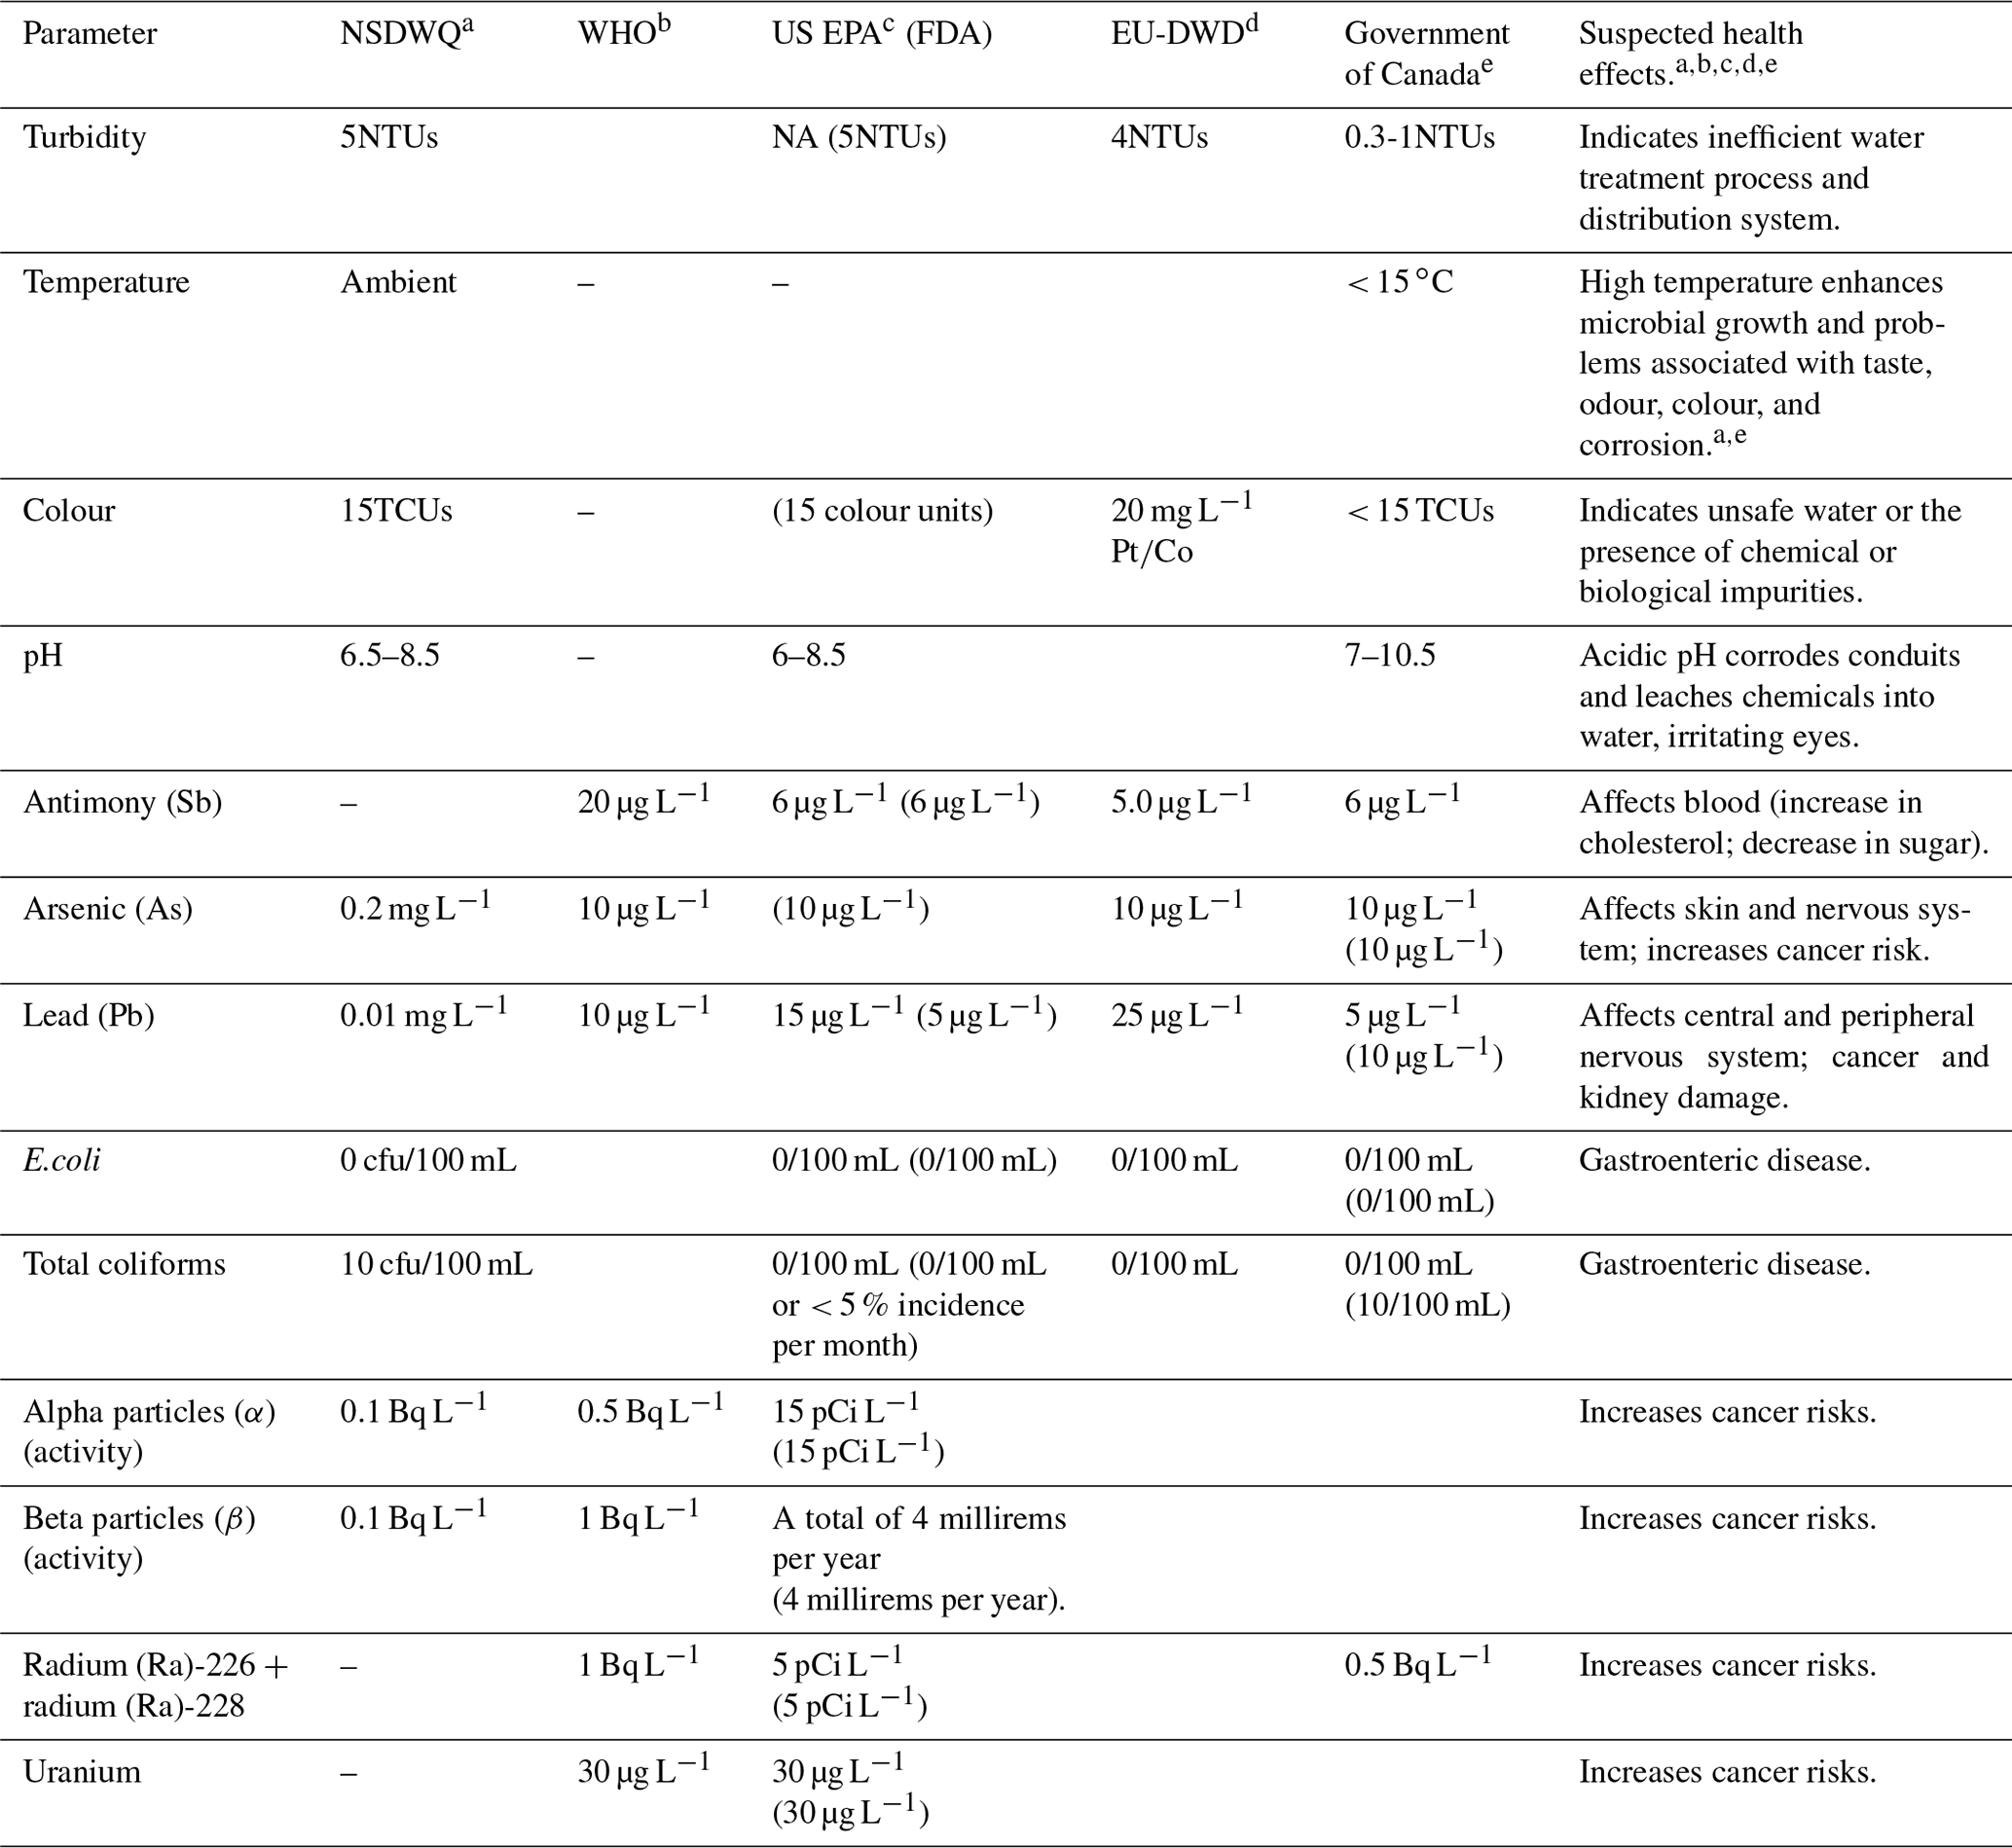
Table 1Regulated standards of selected physical, chemical, biological, and radiological parameters.
a SON (2007); b WHO (2017);
c United States Food and Drug Administration – FDA (2018); US EPA (2001, 2009);
d Drinking Water Inspectorate (2017);
e Government of
Canada (1981, 2020a, b);
Health Canada (2020).
Note: NSDWQ – Nigerian Standard for Drinking Water Quality; WHO – World
Health Organization; US EPA – United States Environmental Protection
Agency; EU-DWD –
European Union Drinking Water Directive; TCUs – true
colour units; NTUs – nephelometric turbidity units; Bq L−1 – becquerel per litre; pCi L−1 – picocuries per litre; µg L−1
– micrograms per litre; mg L−1 – milligrams per litre; mL – millilitres; – platinum-cobalt scale.
A summary of the drinking water and bottled water (shown in parentheses) quality standards available, as issued by major institutions for physical, chemical, biological, and radiological characteristics, and the suspected health effects are presented in Table 1. As seen in Table 1, in the US and Canada, as with many other places, a number of the regulations cover both drinking water and bottled water quality, while for regions like Nigeria no bottled water regulation is in place, and sometimes drinking water quality standards are adopted.
There is increasing concern about the leaching of chemicals from containers (including PET) as a result of increasing ambient temperatures (University of Florida Institute of Food and Agricultural Sciences, 2014; Zanolli, 2019). In most parts of Nigeria, including the study area, bottled water and other assorted drinks for sale are displayed outside stores and in the sun for days and weeks or hawked in traffic by the roadside until they are sold. The country is mostly hot all year round. This study seeks to investigate the changes in levels of specific parameters (antimony, BPA, nitrates, and pH) in five commercially available market brands of bottled water being continually exposed to sunlight for 0–28 d in Bauchi, Bauchi State, Nigeria, and the effects on the quality of the water. The study area is a metropolitan city and capital of Bauchi State in Nigeria. Over the course of the year, temperatures can rise to as high as 40 ∘C around March–April in the study area. The study was carried out between December 2019 and January 2020, when the maximum temperature was around 31 ∘C (World Weather Online, 2020).
2.1 Reagents
Reagent-grade analytical chemicals and deionised water were used for preparing all solutions.
2.2 Sampling of the bottled water
Chemical analysis of the water contained in the plastic bottles was carried out in order to investigate whether the bottles leach chemical(s) to the bottled water under heat (source – the Sun) and the level of the chemical concentration over time (28 d) in the bottled water. A total of five commercially available brands of bottled water (obtained directly from the suppliers) were taken as samples and tested (for pH, antimony, BPA, nitrates, and temperature) immediately afterwards to establish the baseline parameters. Samples (labelled A to E) were exposed to direct sunlight and control samples were kept in storage to replicate non-exposure to direct sunlight. Sample testing was carried out at 14 and 28 d between December 2019 (ambient: max temp – 31 ∘C; average temp – 26 ∘C; min temp – 16 ∘C) and January 2020 (ambient: max temp – 31 ∘C; average temp – 24 ∘C; min temp – 14 ∘C; World Weather Online, 2020) using a destructive sampling technique.
2.3 Procedures used in measuring parameters
pH and temperature were evaluated using standard methods according to APHA (2018c and 2018a, respectively). Antimony was measured according to the 3110 metals by atomic absorption spectrometry (APHA, 2018b). The presence of nitrate was determined using the colorimeter (sulfanilamide method) according to 4500-NO nitrogen (nitrate; APHA, 2018d). Bisphenol A was measured using high-performance liquid chromatography (HPLC) according to the 6810 pharmaceuticals and personal care products (APHA, 2018e).
2.4 Method of data analysis
The data in this study was statistically analysed using R (version 3.6.3; R Core Team, 2020) programming (in RStudio version 1.2.5033). The method of data presentation of tables and charts were done in comparison with the water quality standards set out by WHO (2017) guidelines for drinking water quality, US EPA (2009) National Primary Drinking Water Regulations, and the Nigerian Standard for Drinking Water Quality (NSDWQ).
3.1 pH
The pH values obtained from the tests carried out for the five brands of bottled water are as given in Fig. 1. The baseline (day 0) pH values for all brands ranged between 5.25 and 7.4. For the control sample at days 14 and 28, there was a general decrease in pH, implying an increase in acidity in the five brands. Brand A showed approximately 3.8 % and 5.8 % reduction in pH on days 14 and 28, brand B had 3.6 % and 7.3 %, brand C had 5.4 % and 9.2 %, brand D had 13 % and 20 % (highest reduction), and brand E had 2.8 % and 7 %, respectively. The final pH values at day 28 for brands A, B, C, D, and E were 6.97, 5.93, 6.45, 4.17, and 6.07, respectively (Fig. 1). Samples exposed to direct sunlight had temperatures of 47 and 56 ∘C on days 14 and 28, respectively, with brand A showing 15 % and 20 % reduction in pH at day 14 and day 28, brand B showing 23.4 % and 46.7 %, brand C showing 16 % and 39 %, brand D showing 19.8 % and 49 %, and brand E showing 27 % and 54.8 %, respectively. The final pH values at day 28 for brands A, B, C, D, and E were 5.92, 3.41, 4.32, 2.67, and 2.95, respectively.
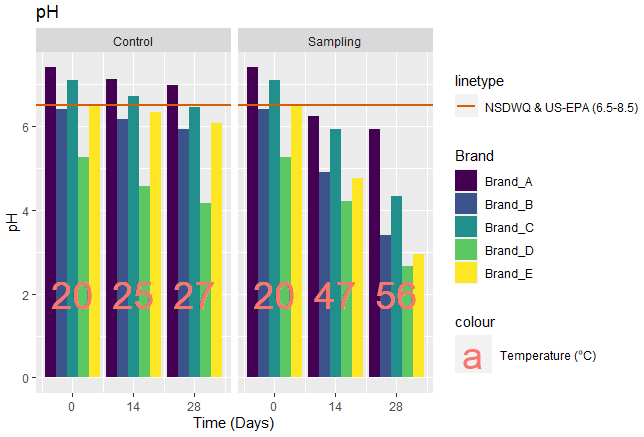
The baseline pH values all fall within range of the standard (NSDWQ and US-EPA – 6.5–8.5), except for brands B and D. For the control samples at the day 28 only brand A had pH at the regulatory level (pH of 6.97). The sources of water may be one of the reasons for the pH values obtained for the control samples. Brand A is sourced directly from a spring aquifer, which may explain why it has the lowest pH (Fisher et al., 2017), while brands B–E source water from deep boreholes, which might account for the changes in the values of pH going noticed (Wright, 2015). The geology of the locations of water source may also have influence on the pH values.
The sample exposed to sunlight had a lower pH (higher acidity) for each brand, and this was also the case as the days of exposure to sunlight increased. This is similar to research by (Muhamad et al., 2011), in which samples were exposed to sunlight for 5 d (there was a decrease in pH with the mean max temperature between 41 to 47 ∘C). However, the result from this study varies from the investigation by Akharame et al. (2018) in that the pH values after 28 d were all within the WHO and NSDWQ regulation levels. WHO has highlighted the health effects of pH < 4 to include eye redness and irritation and, for pH < 2.5, damage to epithelium (WHO, 2003b). The result suggests that sunlight exposure (temperature) affects the pH of bottled water.
3.2 Antimony
The values for antimony obtained from the tests carried out for the five brands of bottled water are as given in Fig. 2. In the baseline measurement (day 0), antimony was not detected in brands A, B, and E while brands C and D had values of 0.095 and 0.35 µg L−1, respectively. At day 14, the control samples had a range of antimony values between 1.53 and 4.35 µg L−1, respectively (Fig. 2). On day 28, antimony levels for the control samples had a range of 2.87 and 5.41 µ g L−1. This corresponded to an 88 %, 45 %, 21 %, 24 %, and 37 % increase from day 14 to day 28 for the control samples. The samples exposed to sunlight had a range of 4.59 and 11.41 µg L−1 on day 14 and 8.17 and 14.49 µg L−1 on day 28. This corresponded to about 78 %, 58 %, 34 %, 27 %, and 8 % increase from day 14 to day 28 of being exposed to sunlight.

The increase in the level of antimony in samples exposed to sunlight after day 28 was higher than in the experiments carried out by Bach et al. (2014). In that research, water samples had an increase in antimony levels from 0.7 to 0.98 µg L−1 (about 27 % or 1.4 times the initial value) and 0 to 0.5 µg L−1 after the 10th day of exposing mineral (non-carbonated) and ultrapure water samples to sunlight, respectively. The increase in the levels of antimony could be attributed to the effects of pH, temperature, and UV radiation (Fig. 2) from the Sun, supported by researchers who identified the significance of pH, temperature, and days of exposure in the amount of Antimony leached into bottled water (Al-Khatim et al., 2019; Chapa-Martínez et al., 2016; Dogan and Cebi, 2019; Zmit and Belhaneche-Bensemra, 2019). The high level of the antimony values can also be attributed to the type of plastics used by the different brands as identified by Koyuncu and Alwazeer (2019), who suspected that the reason for the high antimony levels in milk contained in PET bottles results from the type and production processes employed in making containers. Qiao et al. (2018) also recorded higher values of antimony leached in drinking water bottles exposed to high temperatures. Notably, all control samples did not exceed the US-EPA level of 6 µg L−1 (Fig. 2), while all the samples exposed to sunlight exceeded the US-EPA values after the 14th day, even though they did not exceed the WHO regulation of 20 µg L−1.
3.3 Bisphenol A (BPA)
The values of BPA obtained from the tests carried out for the five brands of bottled water are as given in Fig. 3. The baseline results for both control and sunlight-exposed samples were below the limit of detection, as seen in Fig. 3. For the control sample on day 14, there was increase in the level of BPA to 3.61, 3.92, 4.1, 5.4, and 3.46 µg L−1 for brands A, B, C, D, and E respectively. On the 28th day, there were increases of 14.7 %, 14.5 %, 20.7 %, 25.7 %, and 24.6 %, respectively, from day 14. The samples exposed to sunlight showed BPA levels of 8.64, 9.34, 10.1, 13.42, and 8.59 µg L−1 for Brands A, B, C, D, and E respectively at day 14. There were also corresponding increases on day 28 to 10.34, 11.95, 13.59, 15.48, and 9.72 µg L−1, showing increases of 19.7 %, 28 %, 34.6 %, 15.4 %, and 13.2 %, respectively.

Restrictions on intake per body weight exist, such as the tolerable daily intake (TDI) of 0.05 mg kg−1 body weight (bw) d−1 by European Food Safety Authority (EFSA, 2008). In this study, the highest increase in the BPA level for the control and sunlight-exposed samples was 6.97 and 15.48 µg L−1, respectively, for brand D. Using an average (crude) weight of men and women in the US for 2015/2016 as 89.7 and 77.3 kg (Fryar et al., 2018) and an average daily intake of 4.5 L for a physically active person (WHO, 2005), the daily intake for this study was calculated as 0.772 and 0.901 µg kg (bw)−1 d−1 for men and women, respectively, using Eq. (1). For a child aged 3–6 months, assuming the same amount of BPA is transferred through water intake of 1.171 L d−1 (95th Percentile) (US EPA, 2011), the child will have a BPA level of 18.112 µg d−1 (without dividing by average weight) or 3.012 µg kg (bw)−1 d−1 for a child weighing 6 kg Eq. (1).
where, in the daily intake of BPA for this study (µg kg (bw)−1 d−1), A is the max BPA level in this study (µg L−1), B is the water standard daily intake (L d−1), and C is the average body weight (kg (bw)w).
The TDI stipulated by EFSA (2008) is more than that calculated for men, women and children (0.772, 0.901, and 3.012 µg kg (bw)−1 d−1, respectively), implying that there is no significant risk to a person, based on crude average weight (male, female, and children), and recommended average daily water intake (for physical activity).
3.4 Nitrate
The values for nitrate obtained from the tests carried out for the five brands of bottled water are as given in Fig. 4. The baseline (day 0)) nitrate levels were 0.22, 1, and 0.05 mg L−1 for brands B, C, and D, respectively, while brands A and E were not detected, as seen in Fig. 4. The control samples on day 14 had nitrate level of 0.54, 1.21, 2.41, 0.93, and 0.62 mg L−1 for brands A, B, C, D, and E, respectively. After the day 28, the nitrate level increased by 142.5 %, 100.8 %, 60.2 %, 101.1 %, and 151.6 % for brands A, B, C, D, and E, respectively, corresponding to 1.31, 2.43, 3.86, 1.87, and 1.56 mg L−1. The samples exposed to sunlight showed levels of nitrate after the day 14 as 4.54, 6.12, 7.71, 9.38, and 6.79 mg L−1 for brands A, B, C, D, and E, respectively. An increase was noticed after the day 28 of 66.1 %, 56.2 %, 51 %, 63.2 %, and 56.6 %, corresponding to 7.54, 9.56, 11.64, 15.31, and 10.63 mg L−1 for brands A, B, C, D, and E, respectively. The increase in nitrate can be attributed to the thermal degradation of the polymers in the PET bottle as a result of temperature increase. This is evidenced by research on the temperature effects on bottled water by Muhamad et al. (2011), who found that, from 35 ∘C, “molecular degradation as a result of overheating” causes chemical parameters (including nitrate) to be altered. Figure 4 shows that a temperature of 35 ∘C was exceeded on days 14 and 28 for samples exposed to sunlight.
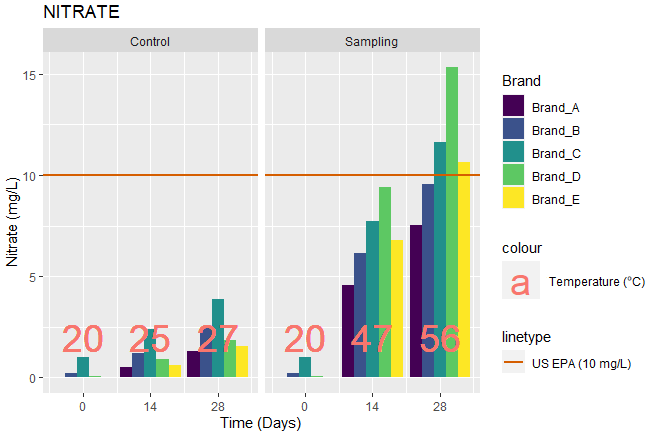
The results showed that all levels of nitrate in the control did not exceed the levels for US EPA (10 mg L−1) or that of the NSDWQ, WHO, or the EU (50 mg L−1). For samples exposed to sunlight, a significant increase was noticed in the level of nitrate as the study progressed, leading (after the day 28) to brands C, D, and E exceeding the US EPA (2009) regulation for nitrates in drinking water. Another study (Muhamad et al., 2011), also recorded an increase in nitrate as temperature increased, although the nitrate levels were not as high as in this study. Lastly, all nitrate values (100 %) in this study still fell below the 50 mg L−1 standards of WHO (2017) and SON (2007).
Leaching of chemicals from PET bottles has been investigated in the literature (Abboudi et al., 2018; Al-Khatim et al., 2019; Zmit and Belhaneche-Bensemra, 2019). This study found that, for each of the parameters, the following conclusions apply:
-
The pH for commercially available brands of bottled water is affected by sunlight exposure and, based on the conditions of storage and sale, will be a potential source of ill health when consumed.
-
Sunlight exposure accelerates the leaching of antimony and nitrates over time, as reported by similar studies. This is in addition to the characteristics of plastic containers used for storing bottled water.
-
Though sunlight exposure increases the leaching of BPA, it does not translate to any significant threat to health when consumed in line with current legislation by the European Food and Safety Agency (EFSA).
-
The level of nitrate leached as a result of sunlight exposure is within the limit set by NSDWQ and WHO.
The software code used in this study is available from the following repository: https://doi.org/10.17632/p29mdksjvs.1 (Wamyil, 2021).
The data used in the study are available from the following repository: https://doi.org/10.17632/6j9m3sgc3x.1 (Wamyil and Daffi, 2021).
RED conceptualised the study, developed the methodology, and carried out the investigation. FBW carried out the analysis and determined the results. Both authors contributed significantly to writing, proofreading, and editing the paper.
The authors declare that they have no conflict of interest.
We appreciate Luuk Rietveld and our anonymous referees for their generous corrections and observations. Second, we also appreciate the opportunity offered by our institutions, University of Jos and Kampala International University, for the teaching and research opportunities.
This paper was edited by Luuk Rietveld and reviewed by two anonymous referees.
Abboudi, M., Aljoumaa, A., and Odeh, A.: Effect of sunlight expousre on PET water bottles during long storage, Aalam Al-Zarra, 150, 51, available at: http://inis.iaea.org/search/search.aspx?orig_q=RN:50039793 (last access: 20 May 2020), 2018.
Akharame, M. O., Ekhosuehi, A., Okolafor, F. I., and Sadoh, K. A.: Effects of Sunlight Exposure on the Quality Parameters of Bottled Water, J. Appl. Sci. Environ. Manag., 22, 769–774, https://doi.org/10.4314/jasem.v22i5.31, 2018.
Al-Khatim, A.-S. A., Shiboob, M. H., and Elgandy, M. F.: Effect of Temperature on Antimony Leaching from Polyethylene Terephthalate (PETE) into Bottled Water, J. King Abdulaziz Univ. – Meteorol. Environ. Arid L. Agric. Sci., 28, 117–124, https://doi.org/10.4197/met.28-1.10, 2019.
APHA: 2550 Temperature (2017), in: Standard Methods For the Examination of Water and Wastewater, Am. Public Health Association, available at: https://www.standardmethods.org/doi/abs/10.2105/SMWW.2882.031 (last access: 10 February 2021), 2018a.
APHA: 3110 Metals by Atomic Absorption Spectrometry (2017), in: Standard Methods For the Examination of Water and Wastewater, Am. Public Health Association (APHA), available at: https://www.standardmethods.org/doi/abs/10.2105/smww.2882.042 (last access: 10 February 2021), 2018b.
APHA: 4500-H+ pH Value (2017), in: Standard Methods For the Examination of Water and Wastewater, Am. Public Health Association, available at: https://www.standardmethods.org/doi/abs/10.2105/SMWW.2882.082 (last access: 10 February 2021), 2018c.
APHA: 4500-NO NITROGEN (NITRATE), in: Standard Methods For the Examination of Water and Wastewater, Am. Public Health Association, available at: https://www.standardmethods.org/doi/abs/10.2105/SMWW.2882.089 (last access: 10 February 2021), 2018d.
APHA: 6810 Pharmaceuticals and Personal Care Products (2017), in: Standard Methods For the Examination of Water and Wastewater, Am. Public Health Association, available at: https://www.standardmethods.org/doi/abs/10.2105/SMWW.2882.134 (last access: 10 February 2021), 2018e.
Bach, C., Dauchy, X., Severin, I., Munoz, J., Etienne, S., and Chagnon, M.-C.: Effect of sunlight exposure on the release of intentionally and/or non-intentionally added substances from polyethylene terephthalate (PET) bottles into water: Chemical analysis and in vitro toxicity, Food Chem., 162, 63–71, https://doi.org/10.1016/j.foodchem.2014.04.020, 2014.
Chapa-Martínez, C. A., Hinojosa-Reyes, L., Hernández-Ramírez, A., Ruiz-Ruiz, E., Maya-Treviño, L., and Guzmán-Mar, J. L.: An evaluation of the migration of antimony from polyethylene terephthalate (PET) plastic used for bottled drinking water, Sci. Total Environ., 565, 511–518, https://doi.org/10.1016/j.scitotenv.2016.04.184, 2016.
Davis, M. L.: Water and Wastewater Engineering: Design Principles and Practice, McGraw-Hill Companies Inc., New York, USA, 2010.
Dogan, C. E. and Cebi, N.: Investigation of antimony, cobalt, and acetaldehyde migration into the drinking water in Turkey, Packag. Technol. Sci., 32, 239–246, https://doi.org/10.1002/pts.2430, 2019.
Drinking Water Inspectorate: What are the Drinking Water Standards?, DWI Advice Leafl., 5, available at: https://cdn.dwi.gov.uk/wp-content/uploads/2020/09/23151708/standards.pdf (last access: 29 April 2020), 2017.
EFSA: Statement of EFSA on a study associating bisphenol A with medical disorders, EFSA J., 838, 1–3, 2008.
FDA: Title 21-Chapter 1-Subchapter B-Part 165 (BEVERAGES)-Subpart B (Requirements for Specific Standardized Beverages)-165.110 (Bottled Water), Electronic Code of Federal regulations (eCFR), available at: https://www.ecfr.gov/cgi-bin/text-idx?SID=a345042f6bd438d7949b0270596b60fd&mc=true&node=se21.2.165_1110&rgn=div8 (last access: 20 December 2020), 2018.
Fisher, B. J., Spencer, A., Haywood, V., and Konchady, G.: Relieving Dry Mouth: Varying Levels of pH Found in Bottled Water, Compend. Contin. Educ. Dent., 38, available at: https://www.aegisdentalnetwork.com/cced/2017/07/relieving-dry-mouth-varying-levels-of-ph-found-in-bottled-water (last access: 20 December 2020), 2017.
Fryar, C. D., Kruszon-Moran, D., Gu, Q., and Ogden, C. L.: Mean body weight, height, waist circumference, and body mass index among adults: United States, 1999–2000 through 2015–2016, Natl. Health Stat. Report., No. 122,aavailable at: https://www.cdc.gov/nchs/data/nhsr/nhsr122-508.pdf (last access: 20 May 2020), 2018.
Gaur, R. C.: Basic Environmental Engineering, New Age International (P) Limited, New Delhi, Indi, 2008.
Government of Canada: Microbiological Examination of Water in Sealed Containers (Excluding Mineral and Spring Water) and Prepackaged Ice, Ottawa, Canada, 1981.
Government of Canada: Food and Drug Act: Food and Drug Regulations (Part B Division 12-Packaged Water and Ice), available at: https://www.laws-lois.justice.gc.ca/eng/regulations/C.R.C.,_c._870/index.html, last access: 21 December 2020a.
Government of Canada: List of contaminants and other adulterating substances in foods-Part 2, available at: https://www.canada.ca/en/health-canada/services/food-nutrition/food-safety/chemical-contaminants/contaminants-adulterating-substances-foods.html, last access 20 December 2020b.
Health Canada: Guidelines for Canadian Drinking Water Quality Summary Table, available at: https://www.canada.ca/en/health-canada/services/environmental-workplace-health/reports-publications/water-quality.html, last access 20 December 2020.
Hurly, A.: A Brief History of Bottled Water, kitchn, available at: https://www.thekitchn.com/a-brief-history-of-bottled-water-228642 (last access 9 May 2020), 2016.
IBWA: Types of Water – Bottled, Int. Bottled Water Assoc, available at: https://www.bottledwater.org/types/bottled-water, last access: 20 May 2020.
International Life Sciences Institute: Packaging Materials: 1. Polyethylene Terephthalate (PET) for Food Packaging Applications, ILSI Eur. Rep. Ser., 1–16, https://doi.org/10.1177/108201320100700217, 2000.
Koyuncu, M. and Alwazeer, D.: Determination of trace elements, heavy metals, and antimony in polyethylene terephthalate–bottled local raw cow milk of Iğdır region in Turkey, Environ. Monit. Assess., 191, 666, https://doi.org/10.1007/s10661-019-7851-z, 2019.
Leigh, E.: The History of Plastic Bottles, Recycl. Nation, available at: https://recyclenation.com/2011/03/history-plastic-bottles-recycle/ (last access: 9 May 2020), 2011.
Malvern Beacon: Holywell, available at: https://www.malvernbeacon.com/malverns-water/holy-well, last access: 9 May 2020.
Mitte Team: From birth to ban, glass to plastic: A global history of bottled water – Mitte, available at: https://mitte.co/2019/01/28/from-birth-to-ban-glass-to-plastic-a-global-history-of-bottled-water/ (last access: 9 May 2020), 2019.
Muhamad, S. G., Lawen, S. E., and Shelear, H. H.: Effect of storage temperature and sunlight exposure on the physicochemical properties of bottled water in Kurdistan region-Iraq, J. Appl. Sci. Environ. Manag., 15, 147–154, https://doi.org/10.4314/jasem.v15i1.65692, 2011.
National Center for Environmental Health, National Center for Health Statistics and National Center for Infectious Diseseases (CDC): Achievements in Public Health, 1900–1999: Control of Infectious Diseases, Morb. Mortal. Wkly. Rep. 48, 621–629, 1999.
Parker, L.: How the plastic bottle went from miracle container to hated garbage, Natl. Geogr., available at: https://www.nationalgeographic.com/environment/2019/08/plastic-bottles/ (last access: 9 May 2020), 2019.
PETRA: Fact Sheet – An Introduction to PET (polyethylene terephthalate), Polyethyl. Terephthalate Resin Assoc. Inf. Use, Benefits Saf. PET Plast. available at: http://petresin.org/news_introtoPET.asp (last access: 11 May 2020), 2015.
Qiao, F., Lei, K., Li, Z., Liu, Q., Wei, Z., An, L., Qi, H., and Cui, S.: Effects of storage temperature and time of antimony release from PET bottles into drinking water in China, Environ. Sci. Pollut. Res., 25, 1388–1393, https://doi.org/10.1007/s11356-017-0598-6, 2018.
R Core Team: R: A language and environment for statistical computing, available at: https://www.r-project.org/ (last access: 10 February 2021), 2020.
Schweppes-Heritage: The Schweppes Story, available at: https://www.schweppes.com.au/heritage/, last access: 9 May 2020.
SON: Nigerian Standard for Drinking Water Quality, Standards Organization of Nigeria (SON), Abuja, Nigeria, 2007.
Spellman, F. R.: Handbook of Water and Wastewater Treatment Plant Operations, Lewis Publishers, Boca Raton, Florida, USA, 2003.
University of Florida Institute of Food and Agricultural Sciences: Don't drink the (warm) water, study says, ScienceDaily, available at: https://www.sciencedaily.com/releases/2014/09/140922110139.htm (last access: 15 May 2020), 2014.
US EPA: Compilation of Air Pollutant Emission Factors AP-42, 5th Edition, North Carolina, available at: https://www3.epa.gov/ttnchie1/ap42/ch06/final/c06s06-2.pdf (last access: 20 May 2020), 1995.
US EPA: Radionuclides Rule: A Quick Reference Guide, available at: https://nepis.epa.gov/Exe/ZyPDF.cgi?Dockey=30006644.txt (last access: 20 May 2020), 2001.
US EPA: National Primary Drinking Water Regulations, available at: https://www.epa.gov/sites/production/files/2016-06/documents/npwdr_complete_table.pdf (last access: 20 May 2020), 2009.
US EPA: Bisphenol A Action Plan (CASRN 80-05-7) [CA Index Name: Phenol, 4,4'-(1-methylethylidene)bis-], available at: https://www.epa.gov/sites/production/files/2015-09/documents/bpa_action_plan.pdf (last access: 20 May 2020), 2010.
US EPA: Exposrue Factors Handbook: 2011 Edition, available at: https://ofmpub.epa.gov/eims/eimscomm.getfile?p_download_id=526160 (last access: 20 May 2020), 2011.
Wamyil, F.: R/RStudio Software code for Evaluation of changes in some physico-chemical properties of bottled water exposed to sunlight in Bauchi State, Nigeria, Mendeley Data, V1, https://doi.org/10.17632/p29mdksjvs.1, 2021.
Wamyil, F. and Daffi, R.: Data recorded/collated for Evaluation of changes in some physico-chemical properties of bottled water exposed to sunlight in Bauchi State, Nigeria, Mendeley Data, V1, https://doi.org/10.17632/6j9m3sgc3x.1, 2021.
WHO: Antimony in Drinking-water: Background document for development of WHO Guidelines for Drinking-water Quality, World Heal. Organ. WHO/SDE/WSH/03.04/74, 1–9, available at: http://www.who.int/water_sanitation_health/dwq/chemicals/antimony.pdf (last access: 20 May 2020), 2003a.
WHO: pH in Drinking-water: Background document for development of WHO Guidel. Drink. Water Qual., 7, available at: https://www.who.int/water_sanitation_health/dwq/chemicals/ph.pdf (last access: 20 May 2020), 2003b.
WHO: Nutrients in Drinking Water, Water, Sanit. Heal. Prot. Hum. Environ., 1–196, available at: https://www.who.int/water_sanitation_health/dwq/nutrientsbegin.pdf (last access: 20 May 2020), 2005.
WHO: Guidelines for Drinking-Water Quality-Fourth Edition Incorporating the First Addendum, Geneva, available at: https://apps.who.int/iris/bitstream/handle/10665/254637/9789241549950-eng.pdf?sequence=1 (last access: 10 May 2020), 2017.
World Weather Online: Historical Average Weather, available at: https://www.worldweatheronline.com/, last access: 18 May 2020.
Wright, K. F.: ADHA/Sigma Phi Alpha Journalism Award: Baccalaureate Is Your Drinking Water Acidic? A Comparison of the Varied pH of Popular Bottled Waters, J. Dent. Hyg., 89, 1–12, 2015.
Zanolli, L.: Bisphenol: what to know about the chemicals in water bottles and cans, The Guardian, available at: https://www.theguardian.com/us-news/2019/may/24/bisphenols-bpa-everyday-toxics-guide (last access: 15 May 2020), 2019.
Zmit, B. and Belhaneche-Bensemra, N.: Antimony leaching from PET plastic into bottled water in Algerian market, Environ. Monit. Assess., 191, 749, https://doi.org/10.1007/s10661-019-7891-4, 2019.