the Creative Commons Attribution 4.0 License.
the Creative Commons Attribution 4.0 License.
 | 09 Feb 2021
Can terminal settling velocity and drag of natural particles in water ever be predicted accurately?
Onno J. I. Kramer
Peter J. Moel
Shravan K. R. Raaghav
Eric T. Baars
Wim H. Vugt
Wim-Paul Breugem
Johan T. Padding
Jan Peter Hoek
Natural particles are frequently applied in drinking water treatment processes in fixed bed reactors, fluidised bed reactors, and sedimentation processes to clarify water and to concentrate solids. When particles settle, it has been found that, in terms of hydraulics, natural particles behave differently when compared to perfectly round spheres. To estimate the terminal settling velocity of single solid particles in a liquid system, a comprehensive collection of equations is available. For perfectly round spheres, the settling velocity can be calculated quite accurately. However, for naturally polydisperse non-spherical particles, experimentally measured settling velocities of individual particles show considerable spread from the calculated average values.
This work aims to analyse and explain the different causes of this spread. To this end, terminal settling experiments were conducted in a quiescent fluid with particles varying in density, size, and shape. For the settling experiments, opaque and transparent spherical polydisperse and monodisperse glass beads were selected. In this study, we also examined drinking-water-related particles, like calcite pellets and crushed calcite seeding material grains, which are both applied in drinking water softening. Polydisperse calcite pellets were sieved and separated to acquire more uniformly dispersed samples. In addition, a wide variety of grains with different densities, sizes, and shapes were investigated for their terminal settling velocity and behaviour. The derived drag coefficient was compared with well-known models such as the one of Brown and Lawler (2003).
A sensitivity analysis showed that the spread is caused, to a lesser extent, by variations in fluid properties, measurement errors, and wall effects. Natural variations in specific particle density, path trajectory instabilities, and distinctive multi-particle settling behaviour caused a slightly larger degree of the spread. In contrast, a greater spread is caused by variations in particle size, shape, and orientation.
In terms of robust process designs and adequate process optimisation for fluidisation and sedimentation of natural granules, it is therefore crucial to take into consideration the influence of the natural variations in the settling velocity when using predictive models of round spheres.
- Article
(11207 KB) -
Supplement
(24330 KB) - BibTeX
- EndNote


1.1 Deviations in the prediction of settling in water treatment processes
The settling behaviour of natural grains in drinking water treatment processes is of great importance (Camp, 1946; Cheremisinoff, 2002; Edzwald, 2011; Howe et al., 2012; Crittenden et al., 2012). Examples include pellet softening in fluidised bed reactors (Graveland et al., 1983), sedimentation, flotation and flocculation, filtration processes (Amburgey, 2005; Tomkins et al., 2005), backwashing of filter media, and washing columns in which fine material and impurities are separated from seeding material (Cleasby et al., 1977; Soyer and Akgiray, 2009). In processes such as pellet softening (Rietveld, 2005; van Schagen, 2009), it is important to always keep the particles in a fluidised state, i.e. to prevent a fixed bed state (which sets the minimum superficial velocity) or flushing state (which sets the maximum superficial velocity). In contrast, in sand filter backwash processes, exceeding the maximum settling velocity, i.e. flushing of impurities and fine materials, is the objective. In these processes, the particle size mostly varies between 0.3–2 mm, and the particle density varies between 1.2–4 kg L−1.
The societal call for a circular economy (Filho and Sümer, 2015; Marques et al., 2015) has put pressure on water utilities to change their policies (Ray and Jain, 2011) – also in terms of making treatment processes more sustainable. The reuse of waste materials is an example of this transition from a linear to a circular approach. Pellet softening, for instance, is an example of a sustainable process (Beeftink et al., 2021) in which fully grown calcium carbonate pellets are crushed and reused as raw material in the process itself (Schetters et al., 2015). The disadvantage, however, is that the processed calcite grains become completely irregularly shaped and show a considerably different hydraulic settling behaviour compared to the generally spherical fully grown calcite pellets. In the case of pellet-softening processes using fluidisation, the spread in the settling velocity can cause the unwanted flushing of smaller grains out of the reactor and the settling of larger grains to the lower region of the reactor, which leads to a fixed bed state. In other processes, like granular activated carbon (GAC) filtration, where bio-based raw materials are receiving more attention compared to fossil fuel-based materials, the settling behaviour is important during filter bed backwashing. The physical properties of bio-based grains are often different compared to conventional grain types, which affects the settling behaviour in backwashing processes as well.
The accurate calculation of the terminal settling velocity of a single particle in water is based on the fluid dynamic drag coefficient, which is accurately known for spherical particles (Clift et al., 1978). However, accurate prediction models for the settling behaviour of polydisperse, highly non-spherical, and porous grains applied in filter backwash systems are limited (Dabrowski et al., 2008; Hunce et al., 2018). Note that the term highly spherical stands for sphere-shaped particles with a sphericity (Φ≈1), the term medium spherical stands for grains with sphericities (0.85 < Φ < 0.99), and the term lightly non-spherical stands for irregularly shaped grains with sphericities (Φ < 0.95). The sphericity of a particle is the ratio of the surface area of a sphere with the same volume as the given particle to the surface area of the particle.
It is important, especially in the field of engineering design and operations for optimal control and optimisation purposes, not only to accurately predict the drag coefficient and terminal settling velocity but also to take into consideration the degree of variation. Aspects such as natural variations in fluid and particle properties, the degree of polydispersity, and other factors that influence the terminal settling velocity will be investigated in this work. In this work, we will investigate the amount and the causes of this spread, something which is hugely underexposed in the popular and often cited prediction models presented in the literature (e.g. Cheng, 1997; Khan and Richardson, 1987; Brown and Lawler, 2003; Zhiyao et al., 2008; Barati and Neyshabouri, 2018).
1.2 Terminal settling and drag coefficient – models from the literature
The literature provides a comprehensive collection of models for the accurate prediction of the terminal settling velocity and drag coefficient for perfectly round spheres. More recently, advanced drag equations for non-spherical particles have been proposed, based on geometrical particle properties. With the help of advanced particle image analysis, it is increasingly possible to determine morphological properties such as sphericity and circularity to predict drag coefficients more accurately. Nearly all prediction models, based on thorough literature surveys, can be found in the publications listed in Table 1.
Table 1Publications with overviews of drag coefficient models.
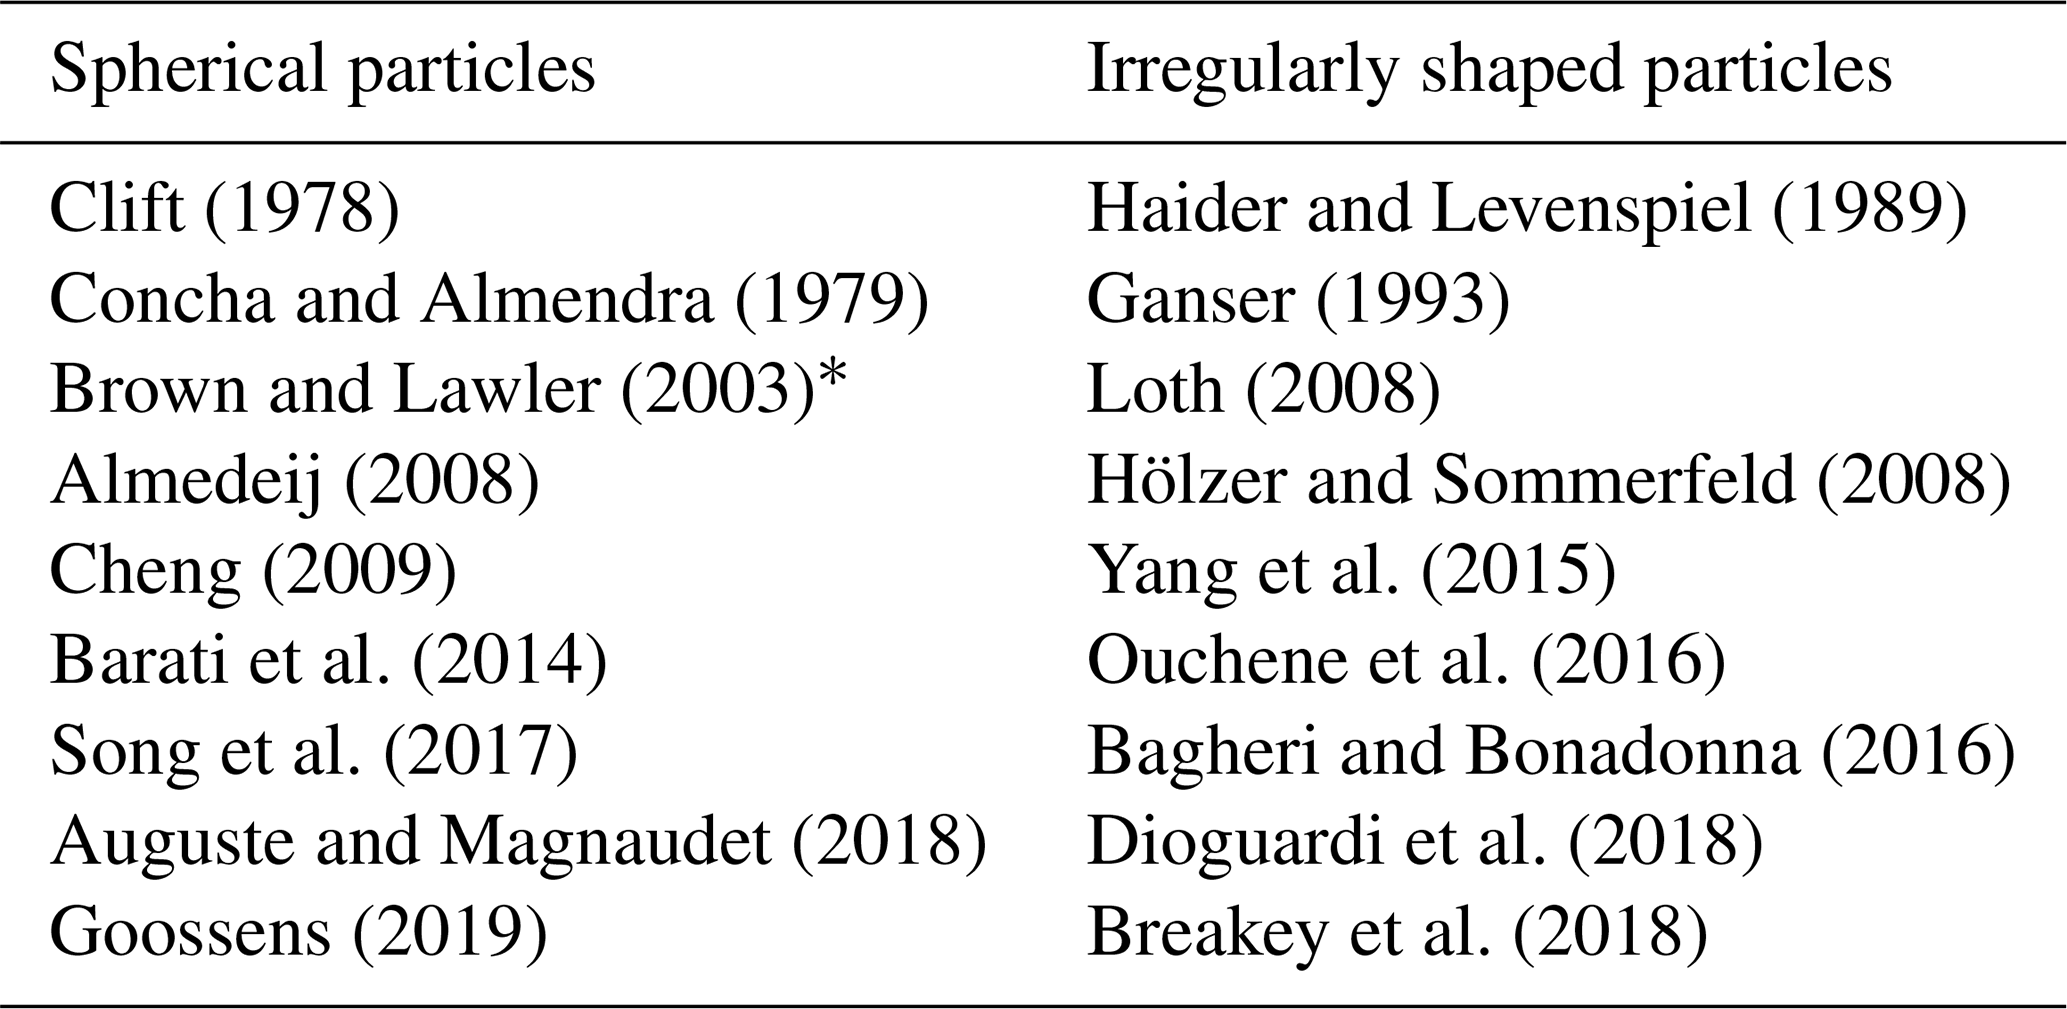
∗ Popular drag coefficient prediction models from the literature and a more detailed explanation of the Brown and Lawler (2003) model are included in the Supplement (Sect. S5).
A very common form of the standard drag coefficient prediction (Eq. 1) is an arrangement of groups, namely laminar (), according to Stokes, transitional () and turbulent (C), according to Clift et al. (1978) and Haider and Levenspiel (1989), as follows:
with Ret referring to the (terminal) Reynolds number described in Eq. (2). Well-known examples of spherical particles are the conventional equation proposed by Schiller and Naumann (1933), the equation proposed by Fair et al. (1954), often applied in water treatment, and the equation proposed by Brown and Lawler (2003), which covers a wide range of terminal Reynolds numbers. Prediction models for non-spherical particles are also based on the appearance of Eq. (1). Examples can be found in Bagheri and Bonadonna (2016) and Dioguardi et al. (2018).
1.3 Terminal settling velocity calculation
The most common way of calculating the terminal settling velocity vt is to predict the dimensionless drag coefficient CD of a single solid sphere in a Newtonian fluid as a function of the Reynolds numbers Ret. The dimensionless particle Reynolds number under terminal settling conditions is the ratio of the inertial force on the particle to the viscous force with a characteristic length and velocity scale, which is typically the volume-equivalent particle diameter dp and terminal velocity as follows:
To actually predict the steady terminal velocity of a given particle with a projected surface area Ap in the direction of the gravitational field from these correlations, one needs to consider a force balance in which the drag force balances the difference between buoyancy and weight (Yang, 2003; Gibilaro et al., 1985; Clift et al., 1978).
For spheres, this leads to an analytic dimensionless drag coefficient, as proposed by Bird et al. (2007) in the following:
This means that the terminal settling velocity can be calculated by combining Eqs. (1), (2), and (4), assuming that the fluid and particle properties are known. The disadvantage of this set of equations is that the terminal settling velocity must be solved numerically.
The literature also provides empirical equations for predicting the terminal settling velocity for specific grains (Concha and Almendra, 1979; Cheng, 1997; Brown and Lawler, 2003; Zhiyao et al., 2008; Terfous et al., 2013; Goossens, 2019).
1.4 Aim
The aim of this work was to illustrate the existence of a considerable spread in the prediction of terminal settling, a process which is mostly determined through the prediction of the drag coefficient. This spread becomes relevant as soon as treatment processes must be designed, controlled, and optimised. Professionals active in fields where the settling of grains is relevant should be aware of this phenomenon. Merely predicting the drag coefficient and terminal settling velocity based on an estimated average particle diameter, using models derived for perfectly round spheres, is insufficient and likely to be highly inaccurate.
Academic research is predominantly focused on improving the standard drag curve (SDC) for a wide range of Reynolds numbers, from completely laminar to fully turbulent, and researchers regularly present accuracy improvements on a relatively small scale (Almedeij, 2008; Barati et al., 2014; Yang et al., 2015; Whiten and Özer, 2015; Song et al., 2017; etc.). The engineering approach, on the other hand, is focused on higher accuracies mainly for a much smaller operational range. With respect to pellet-softening reactors, as applied in drinking water treatment processes, the relevant regime is typically 10 < Ret < 200. The present study aimed to improve our understanding of the principles governing the terminal settling velocity of natural irregularly shaped particles; the numerical prediction of their terminal settling velocity is much more complex than would be the case for perfectly round particles. To address this, a significant number of terminal settling experiments were carried out and compared with the conventional drag force coefficient equations proposed in the literature (Table 1). Additionally, shape descriptors, such as sphericity, were measured.
Improved knowledge in this field enables accurate modelling and optimisation for system and control purposes in automated drinking water treatment processes. This is of value not only for the softening process itself but also for other processes like the sand-washing processes of seeding material in which dust and undesired materials, such as bacteria, are flushed and released from the process. This is particularly important as unreliable prediction models increase the risk of the contamination of the treatment processes, which may adversely affect drinking water quality.
2.1 Experimental approach
A sequence of different experiments was executed (Table 2). The experimental work started with old school settling experiments with natural, highly irregularly shaped particles and ended with terminal settling experiments using an advanced calibrated set-up with high-speed cameras. Old school settling entails measuring the vertical fall velocity of grains, visually, in a quiescent fluid, using a timer.
Table 2Different types of terminal settling experiments.
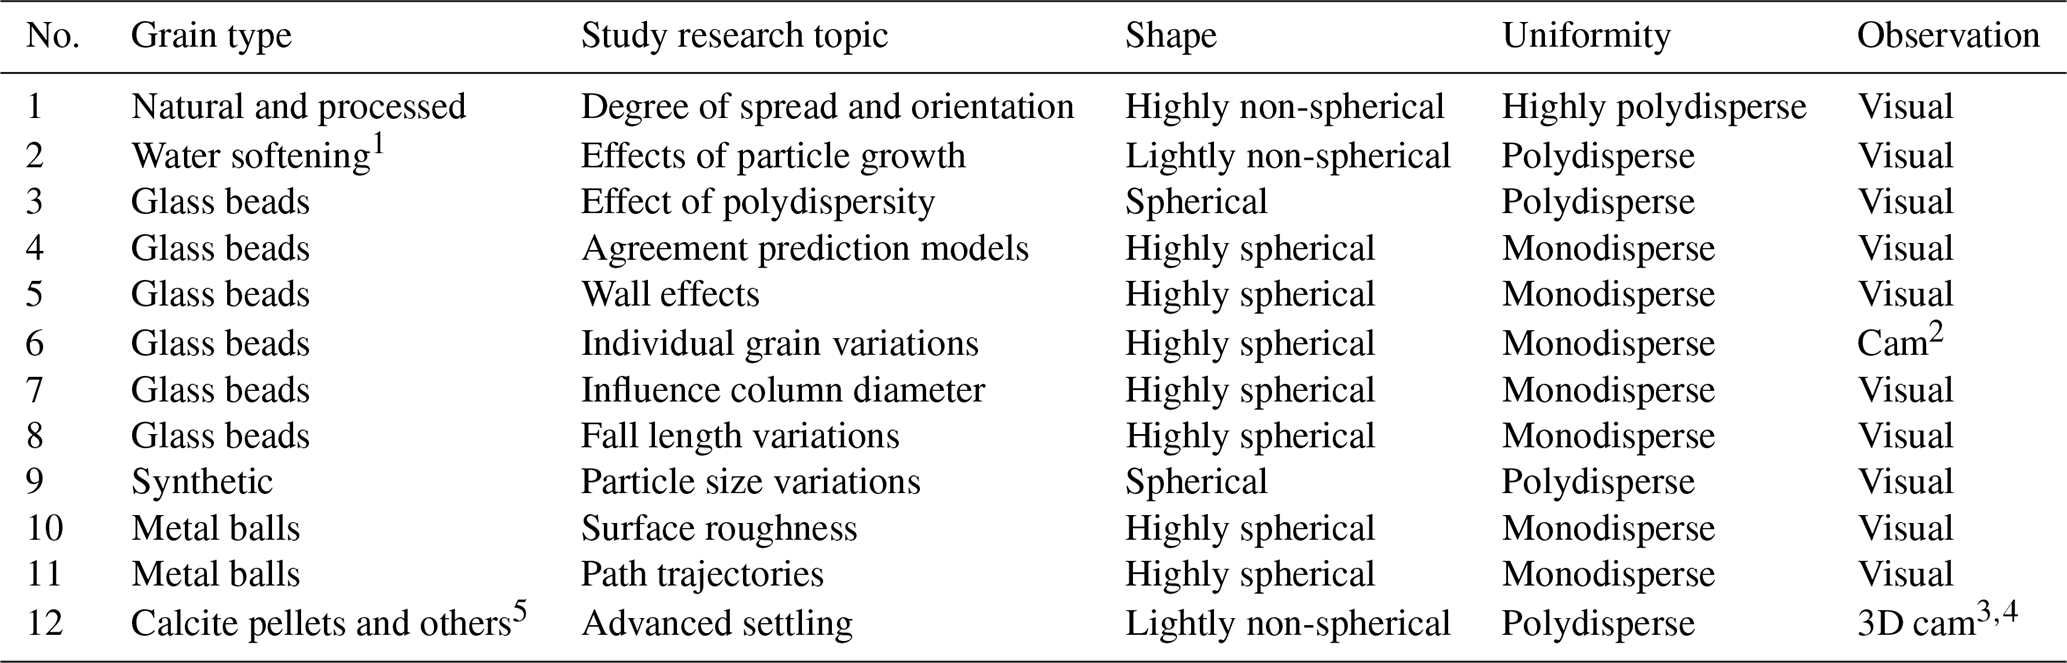
1 Calcite pellets, crushed calcite, and garnet sand. 2 Default traditional camera. 3 A 3D trajectory of particle paths, using particle tracking velocimetry in a quiescent fluid. 4 Path trajectory videos are shared by Kramer et al. (2020c). 5 Metal balls, glass beads, and synthetic material.
The goal of these experiments was to identify the influence of particle size and shape and fluid properties on the terminal settling velocity and settling behaviour.
2.2 Particle selection
For the terminal settling experiments, opaque and transparent spherical polydisperse and monodisperse glass beads were selected. We also examined drinking-water-related particles such as calcite pellets and crushed calcite seeding material grains, both of which are applied in drinking water softening. Polydisperse calcite pellets were sieved and separated to acquire more uniformly dispersed samples. In addition, a wide variety of grains with different densities, sizes and shapes were investigated for their terminal settling velocity and behaviour. The morphological particle properties were obtained with the help of laboratory instruments (Retsch Camsizer XT) and image analysis software (ImageJ).
2.3 Experimental set-up
Experimental columns (D=57 mm) were designed for liquid–solid fluidisation (Kramer et al., 2020a, b) and terminal settling experiments, installed at the following three locations: in Waternet's Weesperkarspel drinking water pilot plant located in Amsterdam, the Netherlands, at the HU University of Applied Sciences Utrecht, the Netherlands, and at Queen Mary University of London, United Kingdom (Fig. 1). Moreover, an experimental column (D=125 mm) was installed at Waternet and the HU University of Applied Sciences Utrecht. Finally, an advanced experimental pilot set-up at the Delft University of Technology (TU Delft) was used to determine particle 3D trajectories using particle tracking velocimetry in a quiescent fluid (Fig. 2).
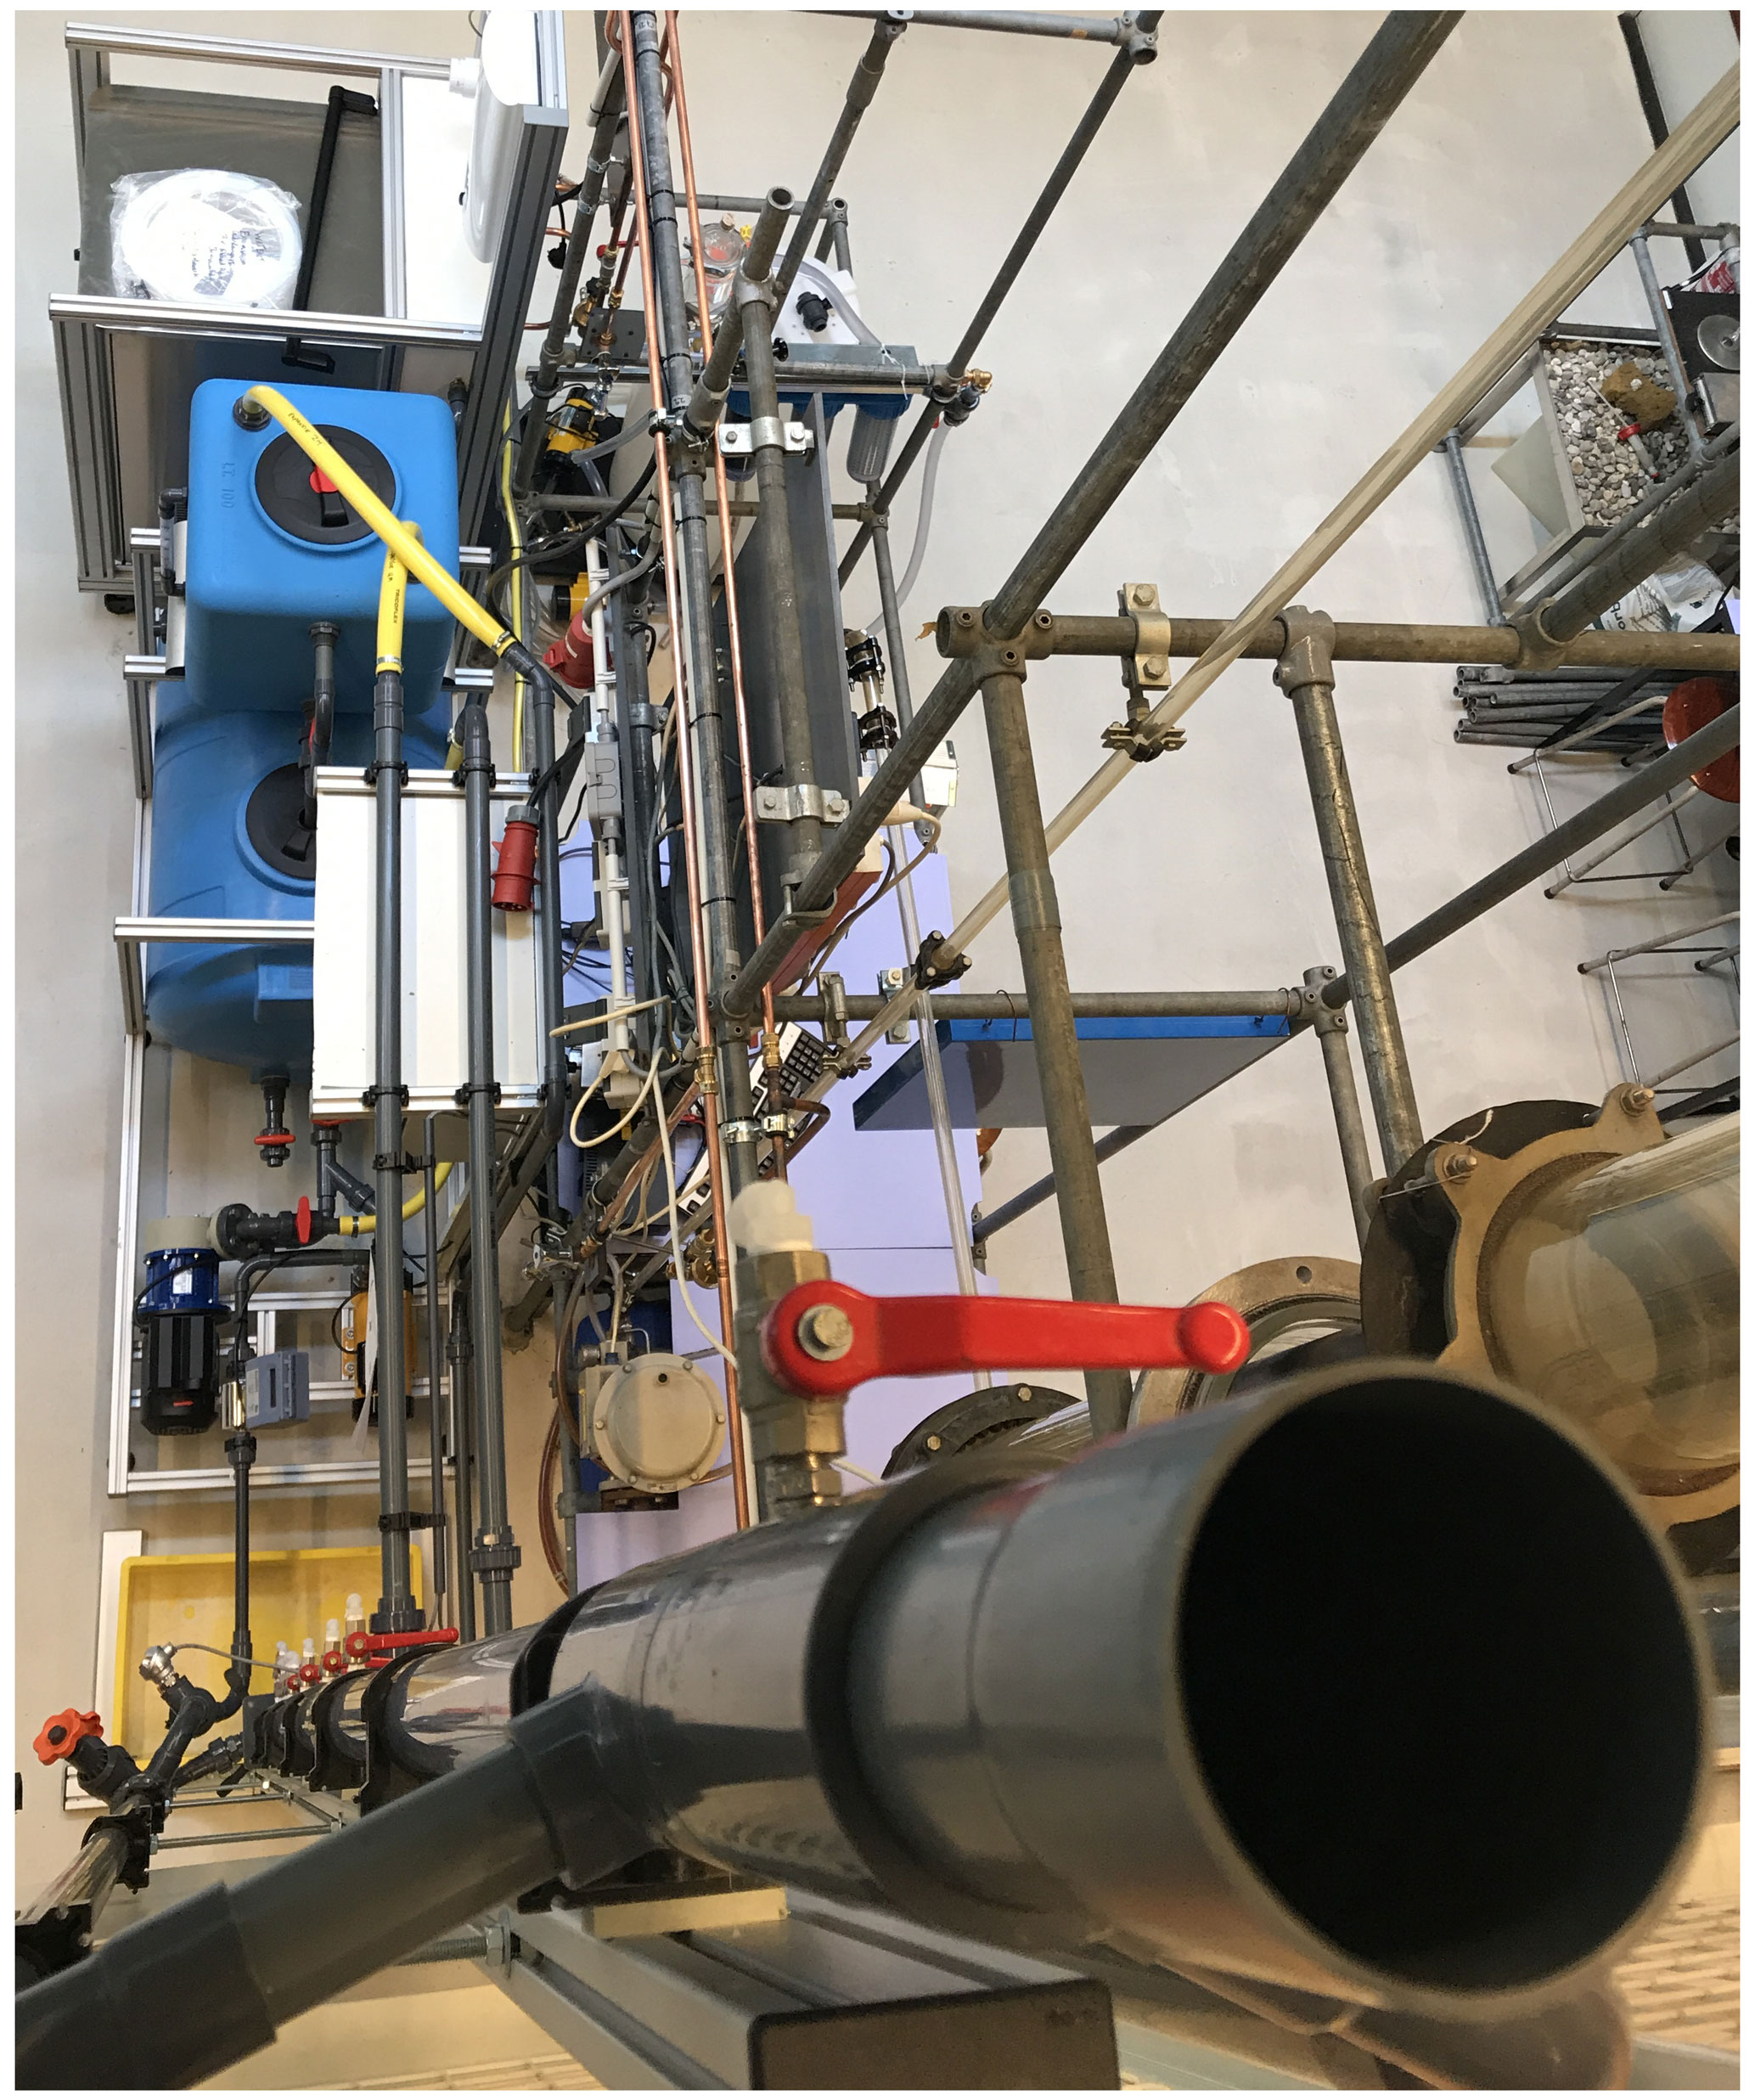
Figure 1Experimental pilot set-up in Amsterdam, Utrecht, and London. D=57 mm, with temperature control column (top view).
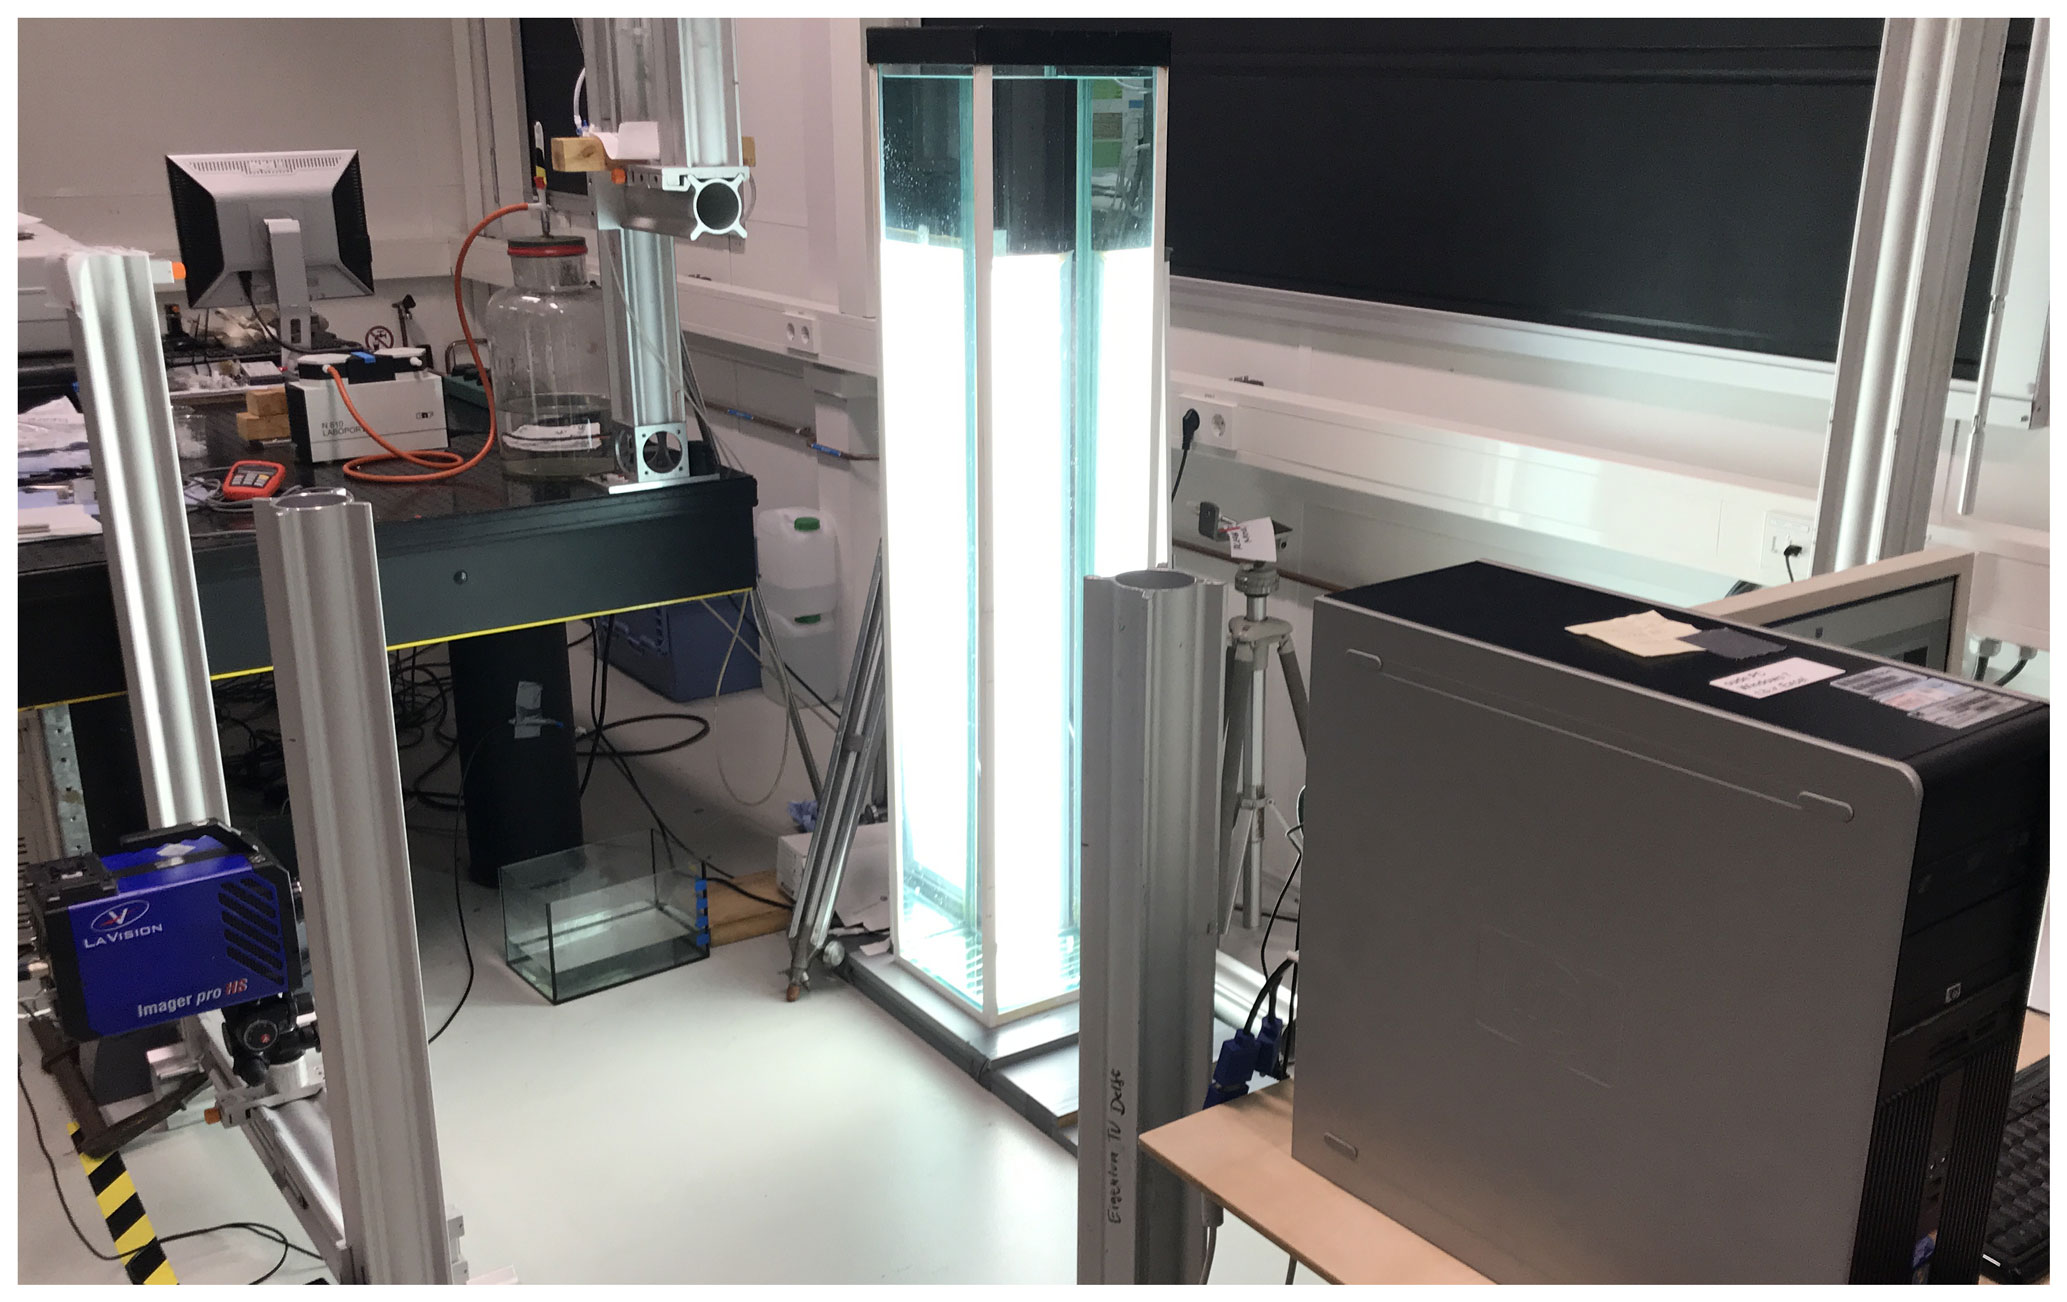
Figure 2Experimental pilot set-up (D=300 mm) at the Delft University of Technology (TU Delft) to determine particle 3D path trajectories in a quiescent fluid with high-speed cameras.
2.4 Procedure
The settling behaviour of single particles was determined for various materials and for different grain sizes. The temperature was carefully controlled by flowing water through the column of the exact temperature before each experiment and by regularly repeating this process throughout the experiment. Individual particles were dropped at the top of the column. Steady state velocities were reached within 1 s and before a distance of L=0.1 m. The condition to be met for steady state velocity is that the particle travels a distance of at least O(100×dp) or greater before the stopwatch is switched on. After the steady state velocity had been reached, the time required to travel a defined vertical distance (L=0.50–3.75 m) was measured visually by the laboratory researcher and the assistant.
2.5 Reference data
In addition to the experiments, a large data set obtained from the literature was examined; this will be discussed in Sect. 3.5.
The Supplement includes technical information about the experimental set-up devices and flow chart diagram and procedures (Sect. S1), photographic pictures of grains used in water treatment processes (Sect. S2), and steady state conditions (Sect. S11).
3.1 Standard drag curve with average values
In total, 3629 new individual terminal settling experiments were executed (Table 2), which marked the starting point of the spread analysis. Raw data are included in the Supplement (Sect. S17). The results, in accordance with the standard drag curve approach (Lapple and Shepherd, 1940), are plotted in Fig. 3, where experimental results for repeated experiments on sets of the same type and size of particles have been averaged (symbols). Additionally, Fig. 3 includes popular prediction models (lines). The prediction model equations are included in the Supplement (Sect. S5). A preliminary evaluation (Fig. 3) indicates that the prediction accuracy is reasonably good for most of the grains. Exceptional outliers are wetted GAC Norit ROW 0.8 Supra grains (rods), due to particle rotation and their delayed settling behaviour, and the 10 mm glass beads, due to wall effects ().
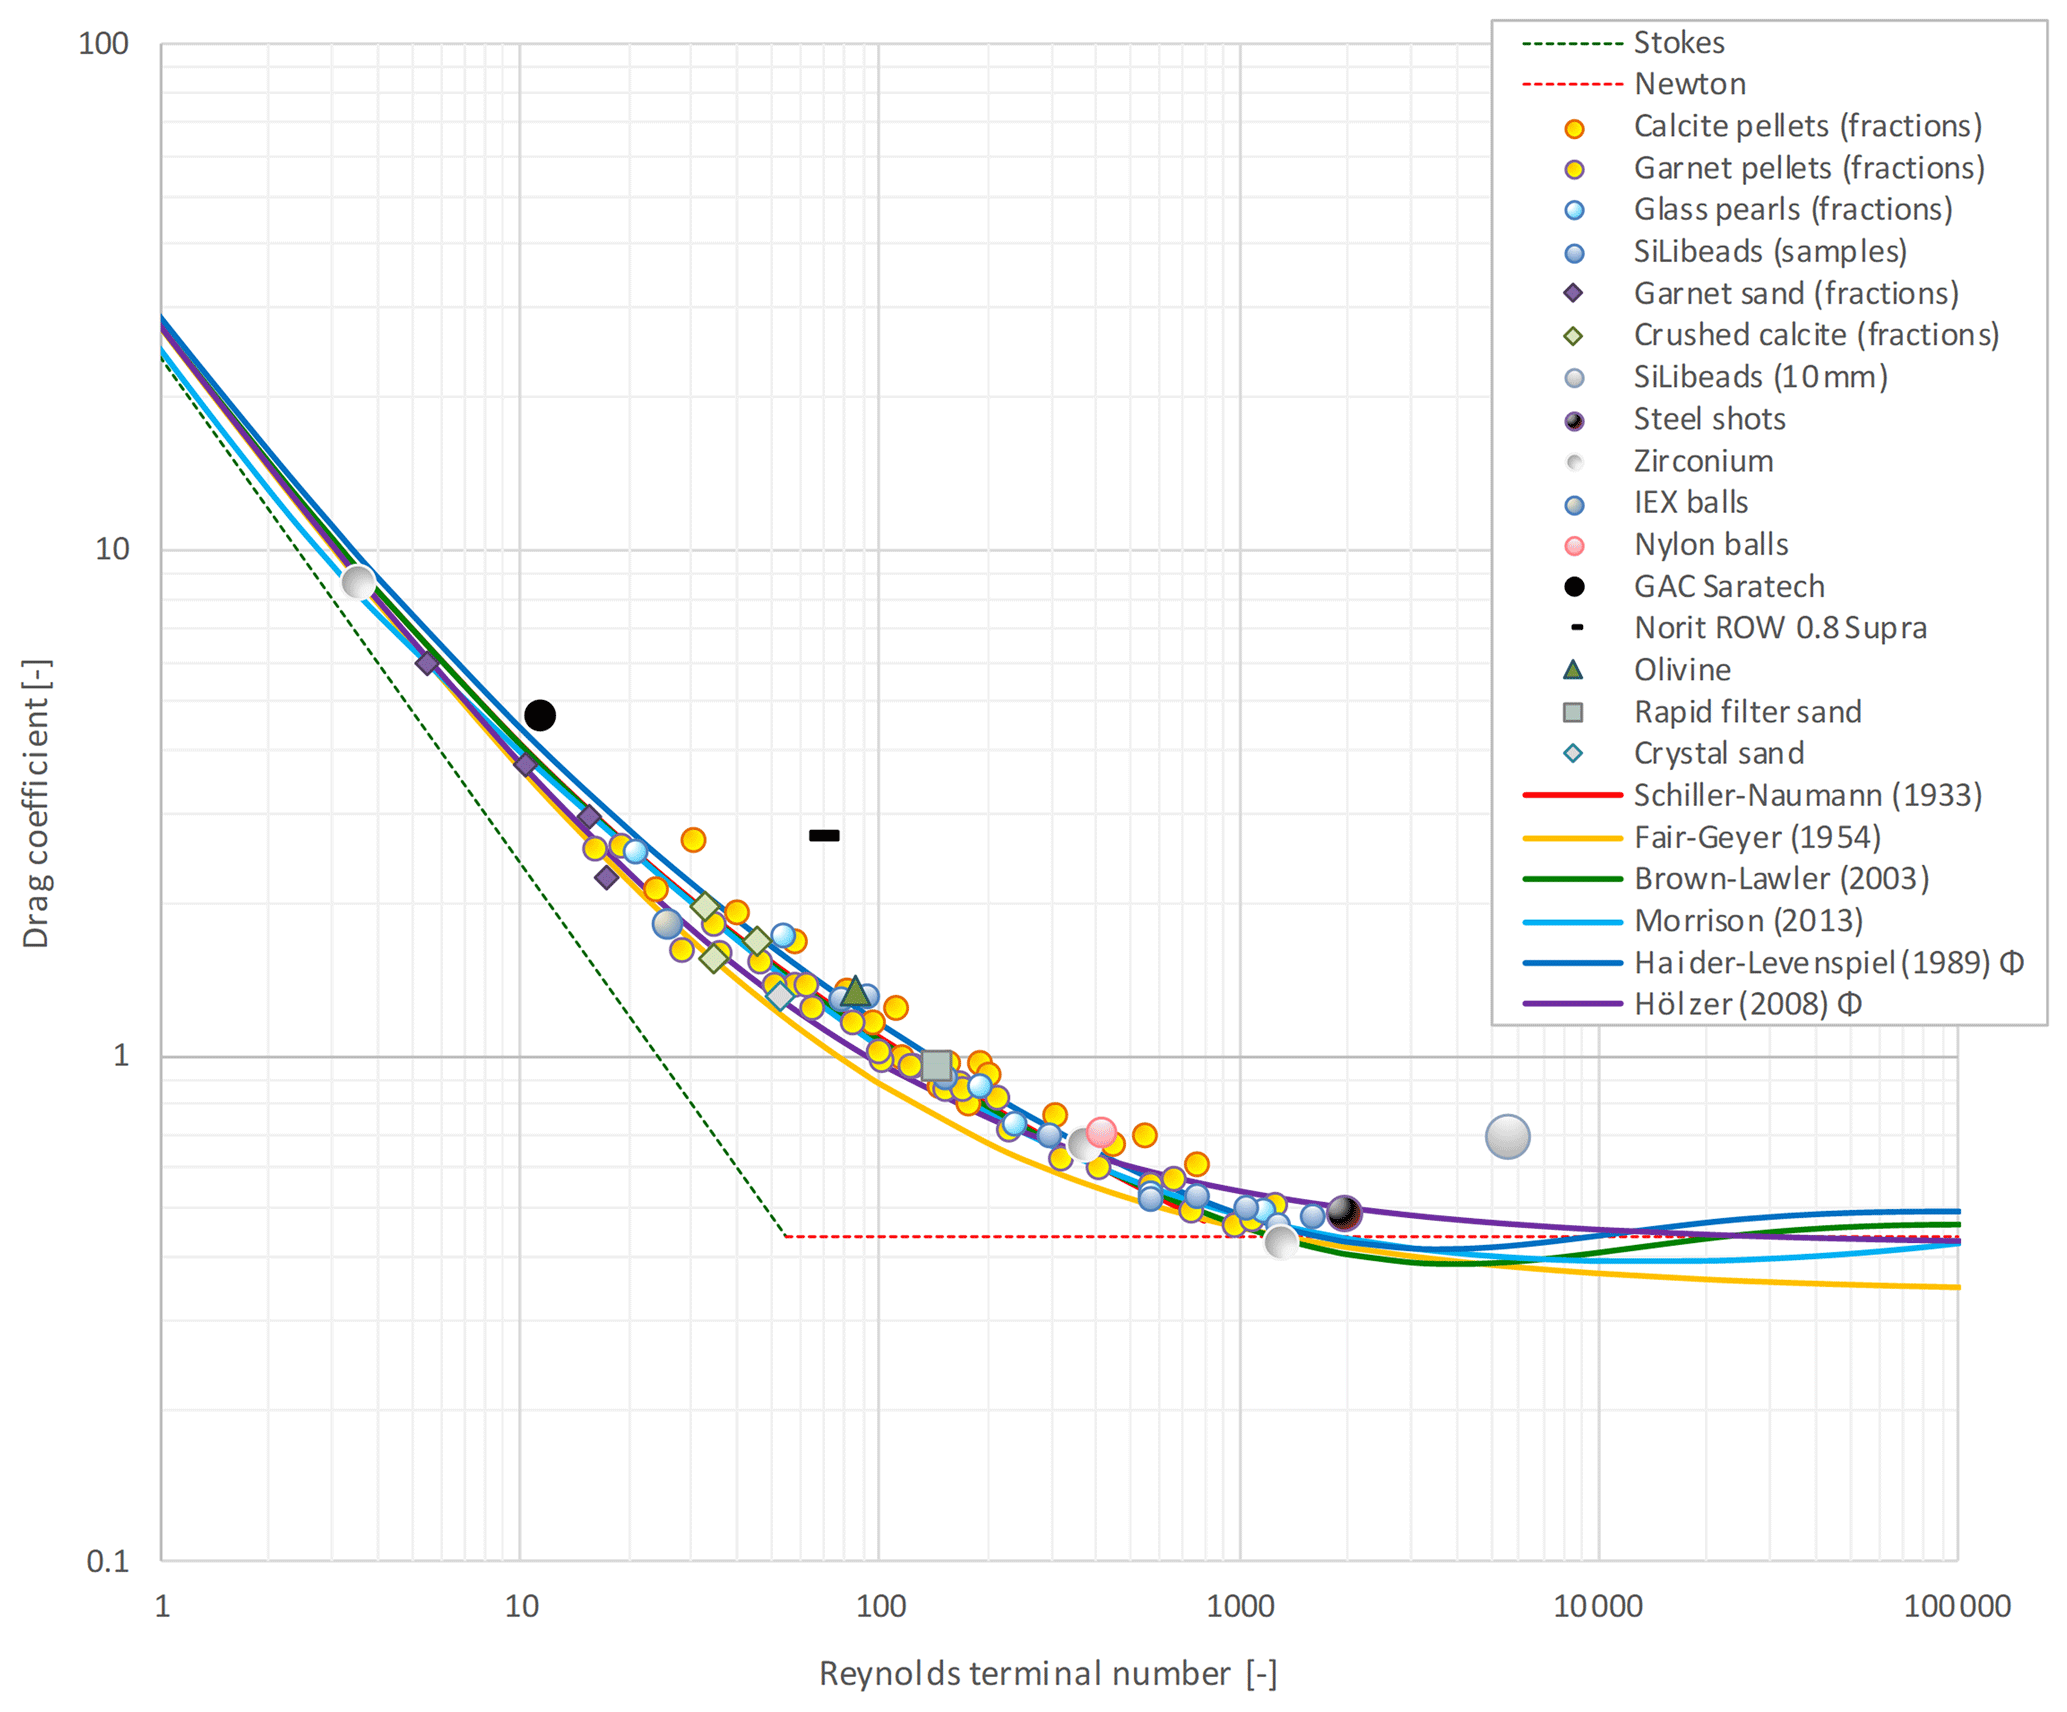
Figure 3Standard drag curve (SDC) for 3629 grains, using averaged values over multiple experiments, for 16 types of materials compared with popular prediction models for spherical and non-spherical particles. The symbol Φ indicates that the measured sphericity is included in the model. Extended SDC, with all examined models, is given in the Supplement (Sects. S5 and S7).
Table 3Drag coefficient and terminal settling velocity prediction accuracy for individual terminal settling experiments (N=3629). Note: average relative error – ARE; normalised root mean square error – NRMSE; correlation coefficient – R2. The symbol Φ indicates that the measured sphericity is included in the model.
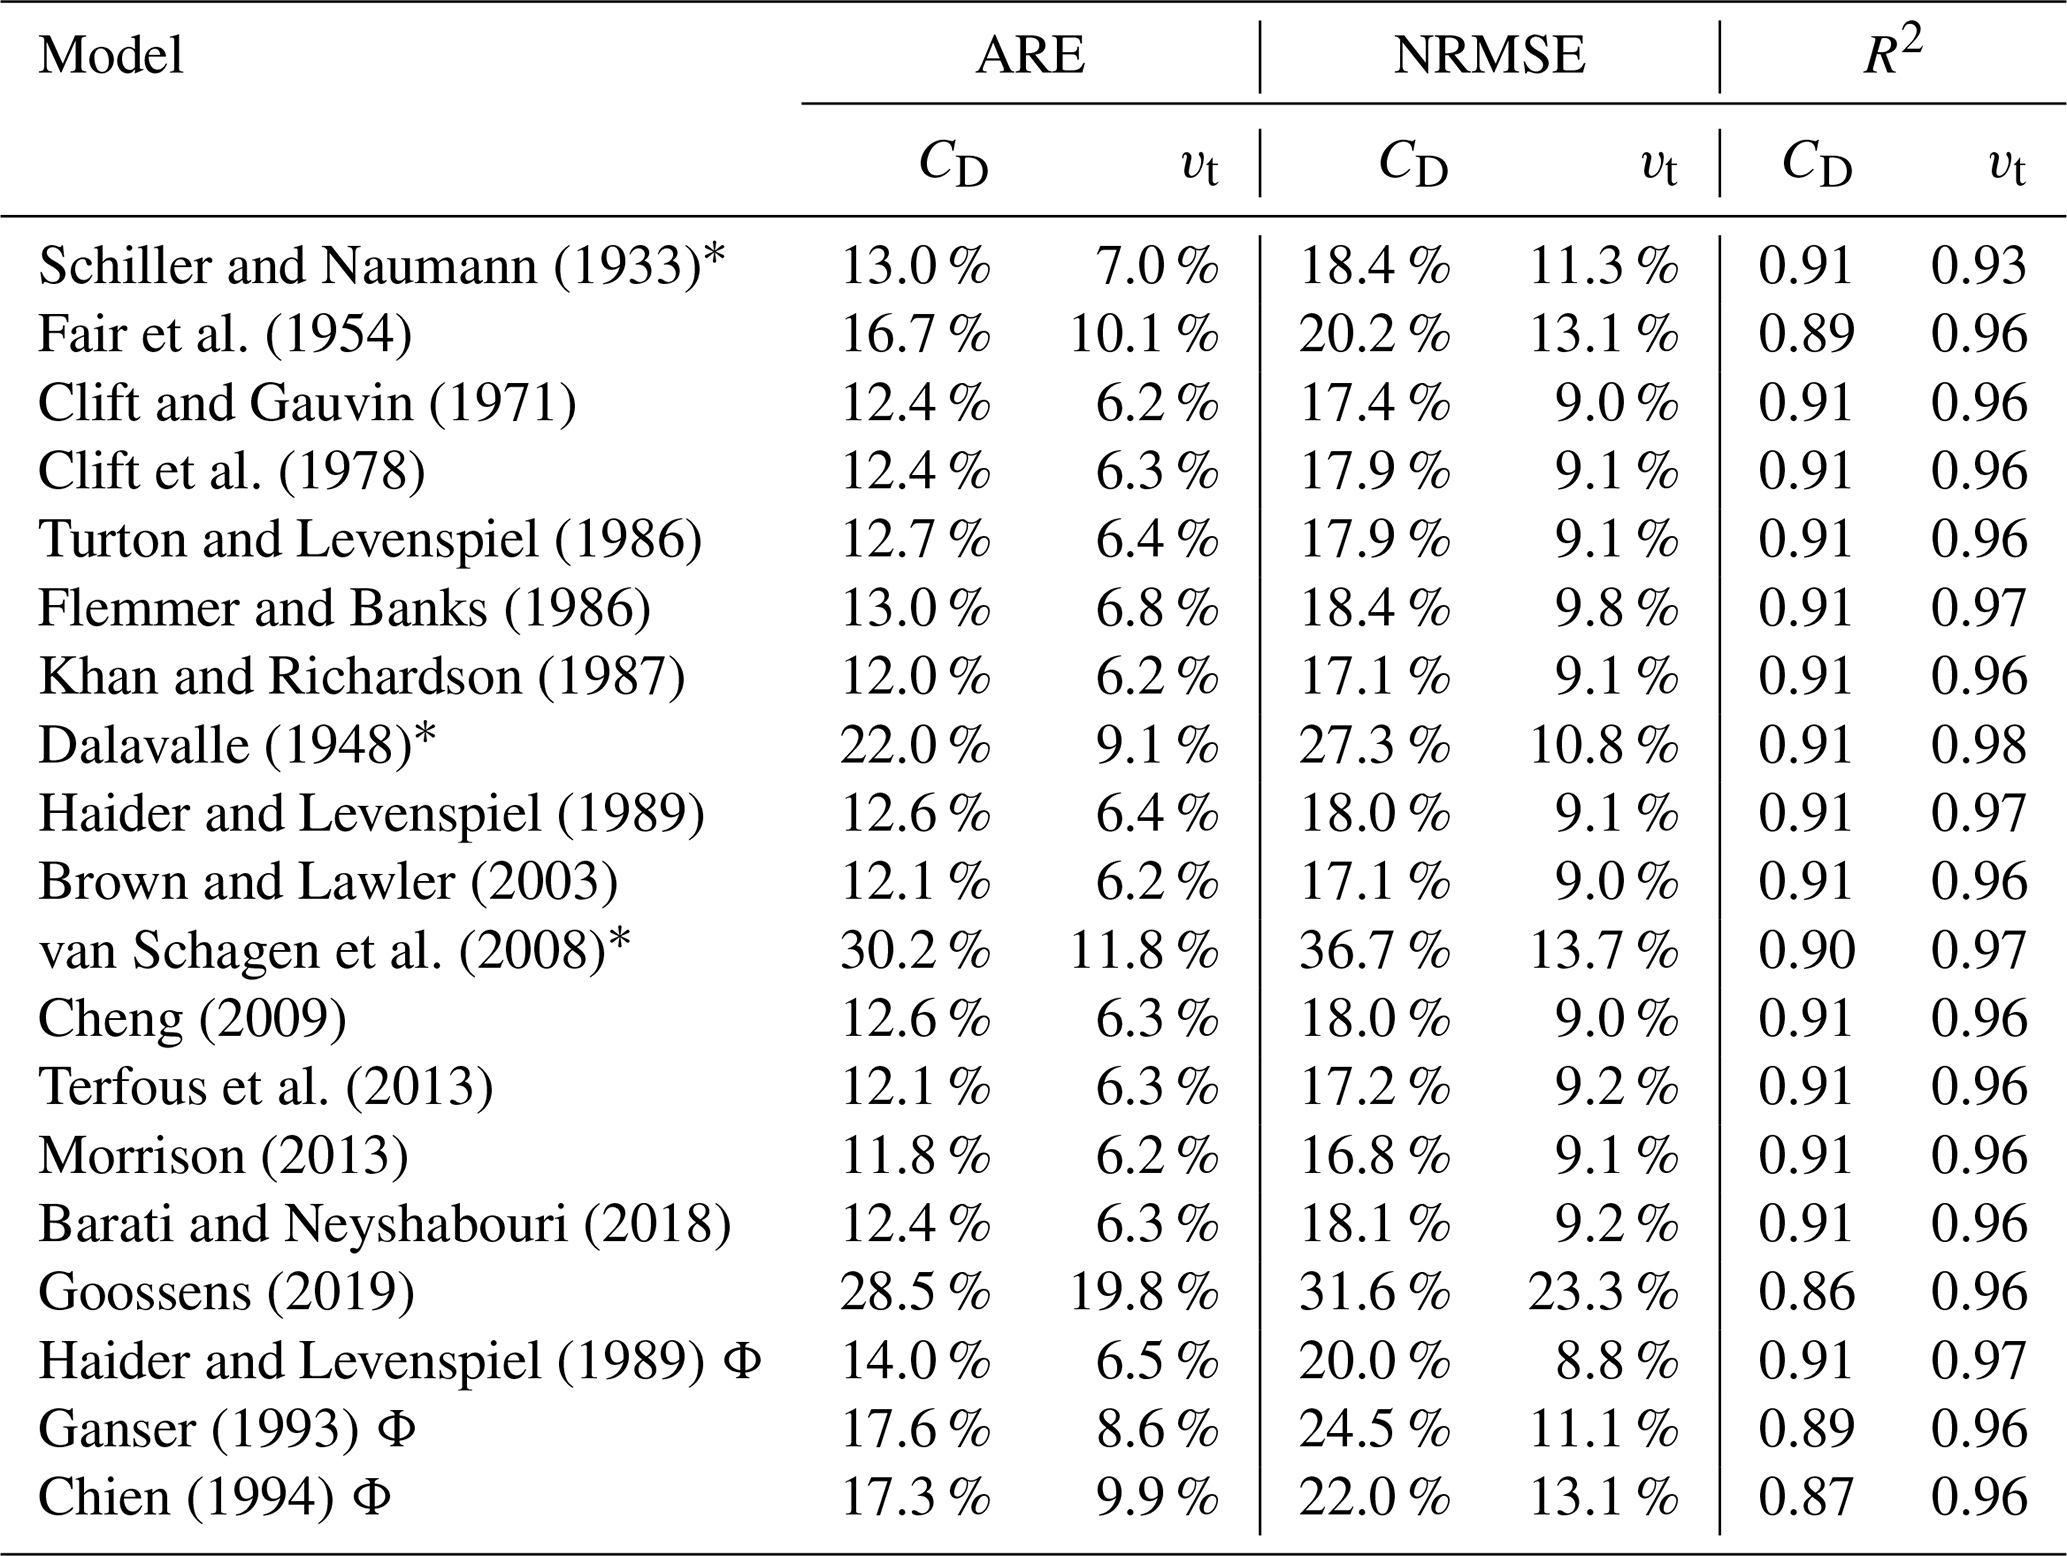
∗ Results were rejected when boundary conditions (known limits of applicability) were violated.
Experimental and model results were compared using two statistical error definitions and correlation coefficients; findings are presented in Table 3. To cope with the irregularity of natural particles, the measured sphericity was used for models developed for non-spherical particles. With respect to the terminal velocity, the calculated normalised root mean square error (NRMSE) for the best-known models derived for spherical particles, such as Brown and Lawler (2003) and Schiller and Naumann (1933), is in the range of 9 %–11 %.
3.2 Drag coefficient and terminal settling velocity prediction versus spread in measured data
Many drag coefficient prediction models found in the literature (Table 1) are based on fits through data sets provided in the literature. Most of the data are based on previous experimental work. In most cases, it remains unexplained, and thus unverifiable, whether the data in the literature represent raw data from single experiments or whether they were processed, for example, by being filtered (by removing outliers), averaged (using statistics), or corrected (for instance by correcting for wall effects). In the current work, we will be explicit about all data-processing steps.
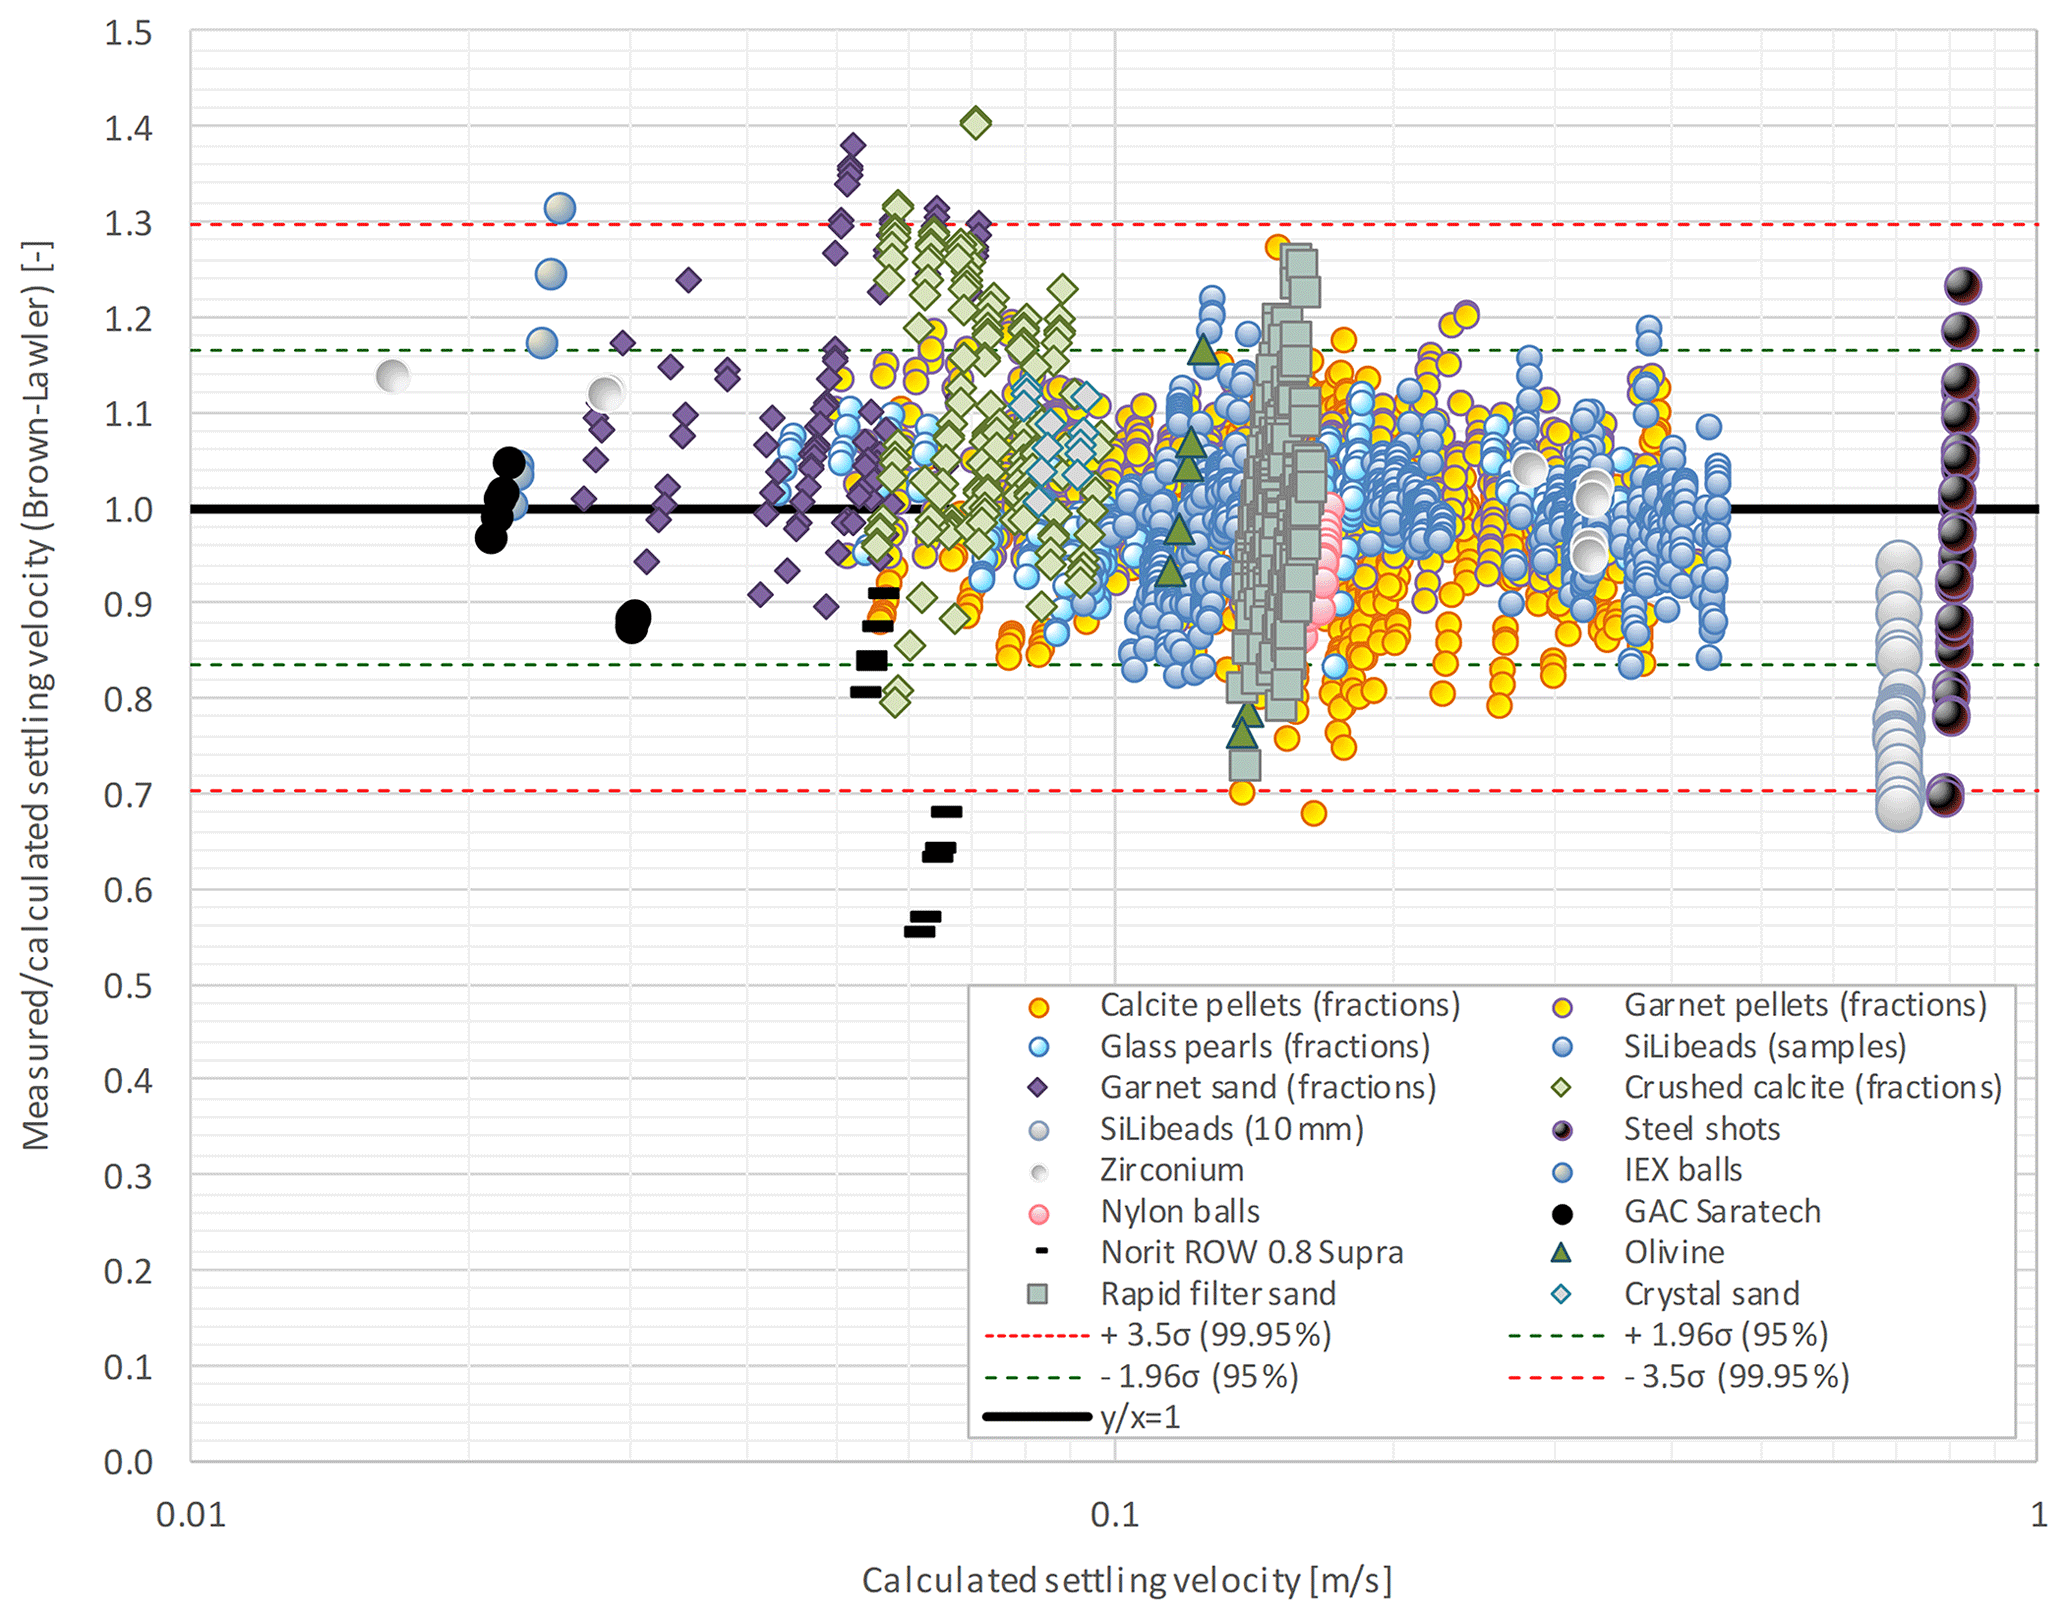
Figure 4Ratio of measured and calculated terminal settling velocities (Brown and Lawler, 2003) against calculated settling velocity. Statistical probability estimation 95 % (μ ± 1.96σ) plot and the (μ ± 3.5σ) show the outliers (0.9 %), which are 32 of 3629 experimental values. A similar graph for the drag coefficient is given in the Supplement (Sect. S9).
To see the amount of variation in an individual particle level, i.e. when no average is calculated, the ratio of the measured to calculated settling velocity (according to Brown and Lawler, 2003) was plotted against the calculated settling velocity in Fig. 4. To identify statistical outliers, a 3.5σ bandwidth was added to Fig. 4. Of the experimental data, 0.9 % can be identified as outliers. The largest spread is shown for non-spherical particles such as granular activated carbon, olivine, anionic exchange resin (IEX), and garnet grains. In the case of garnet sand, outliers can be attributed to the distinctive experimental method of multi-particle settling, i.e. hindered settling (Loeffler, 1953; Baldock et al., 2004; Tomkins et al., 2005). As the smallest garnet grains were difficult to detect, multiple grains were settled instead of one single grain. The trends in Fig. 4 are prominent, which indicates that individual variability cannot simply be ignored.
3.3 Uncertainty analysis
To better estimate the consequences of spread and, accordingly, to be able to compensate for this in full-scale operational processes, it is important to know which parameters cause the spread in drag and observed settling velocity. We started with an uncertainty analysis to estimate the degree of deviation in variables caused by the following uncertainties in measured parameters (Table 4), to be able to add error bars to the standard drag curves. The estimates of uncertainty in CD and Ret as well as in ρp and vt were calculated according to the propagation of errors method (Ku, 1966).
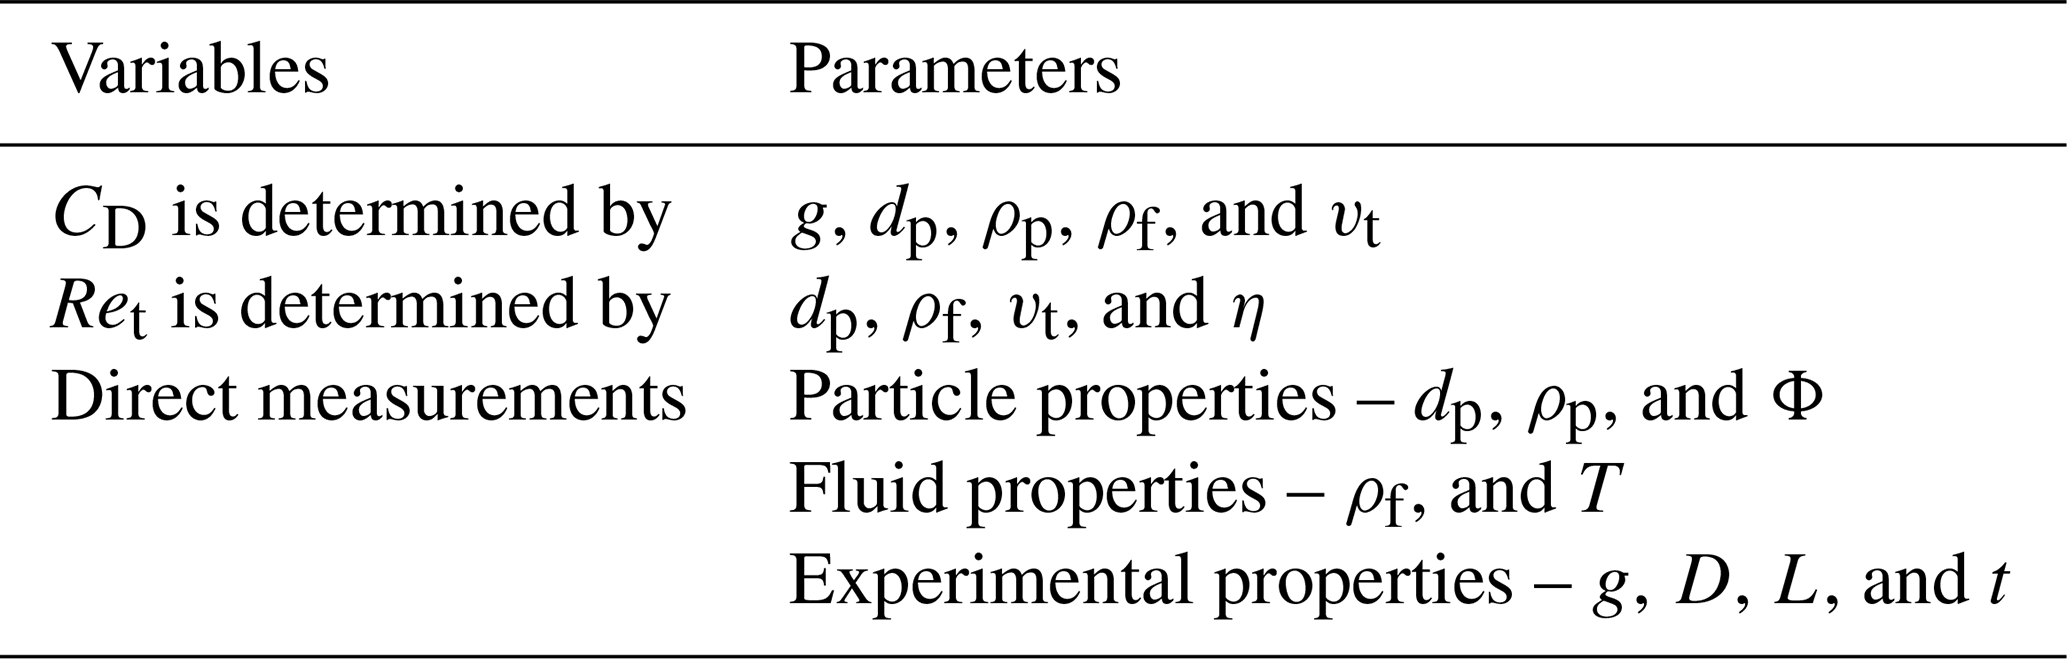
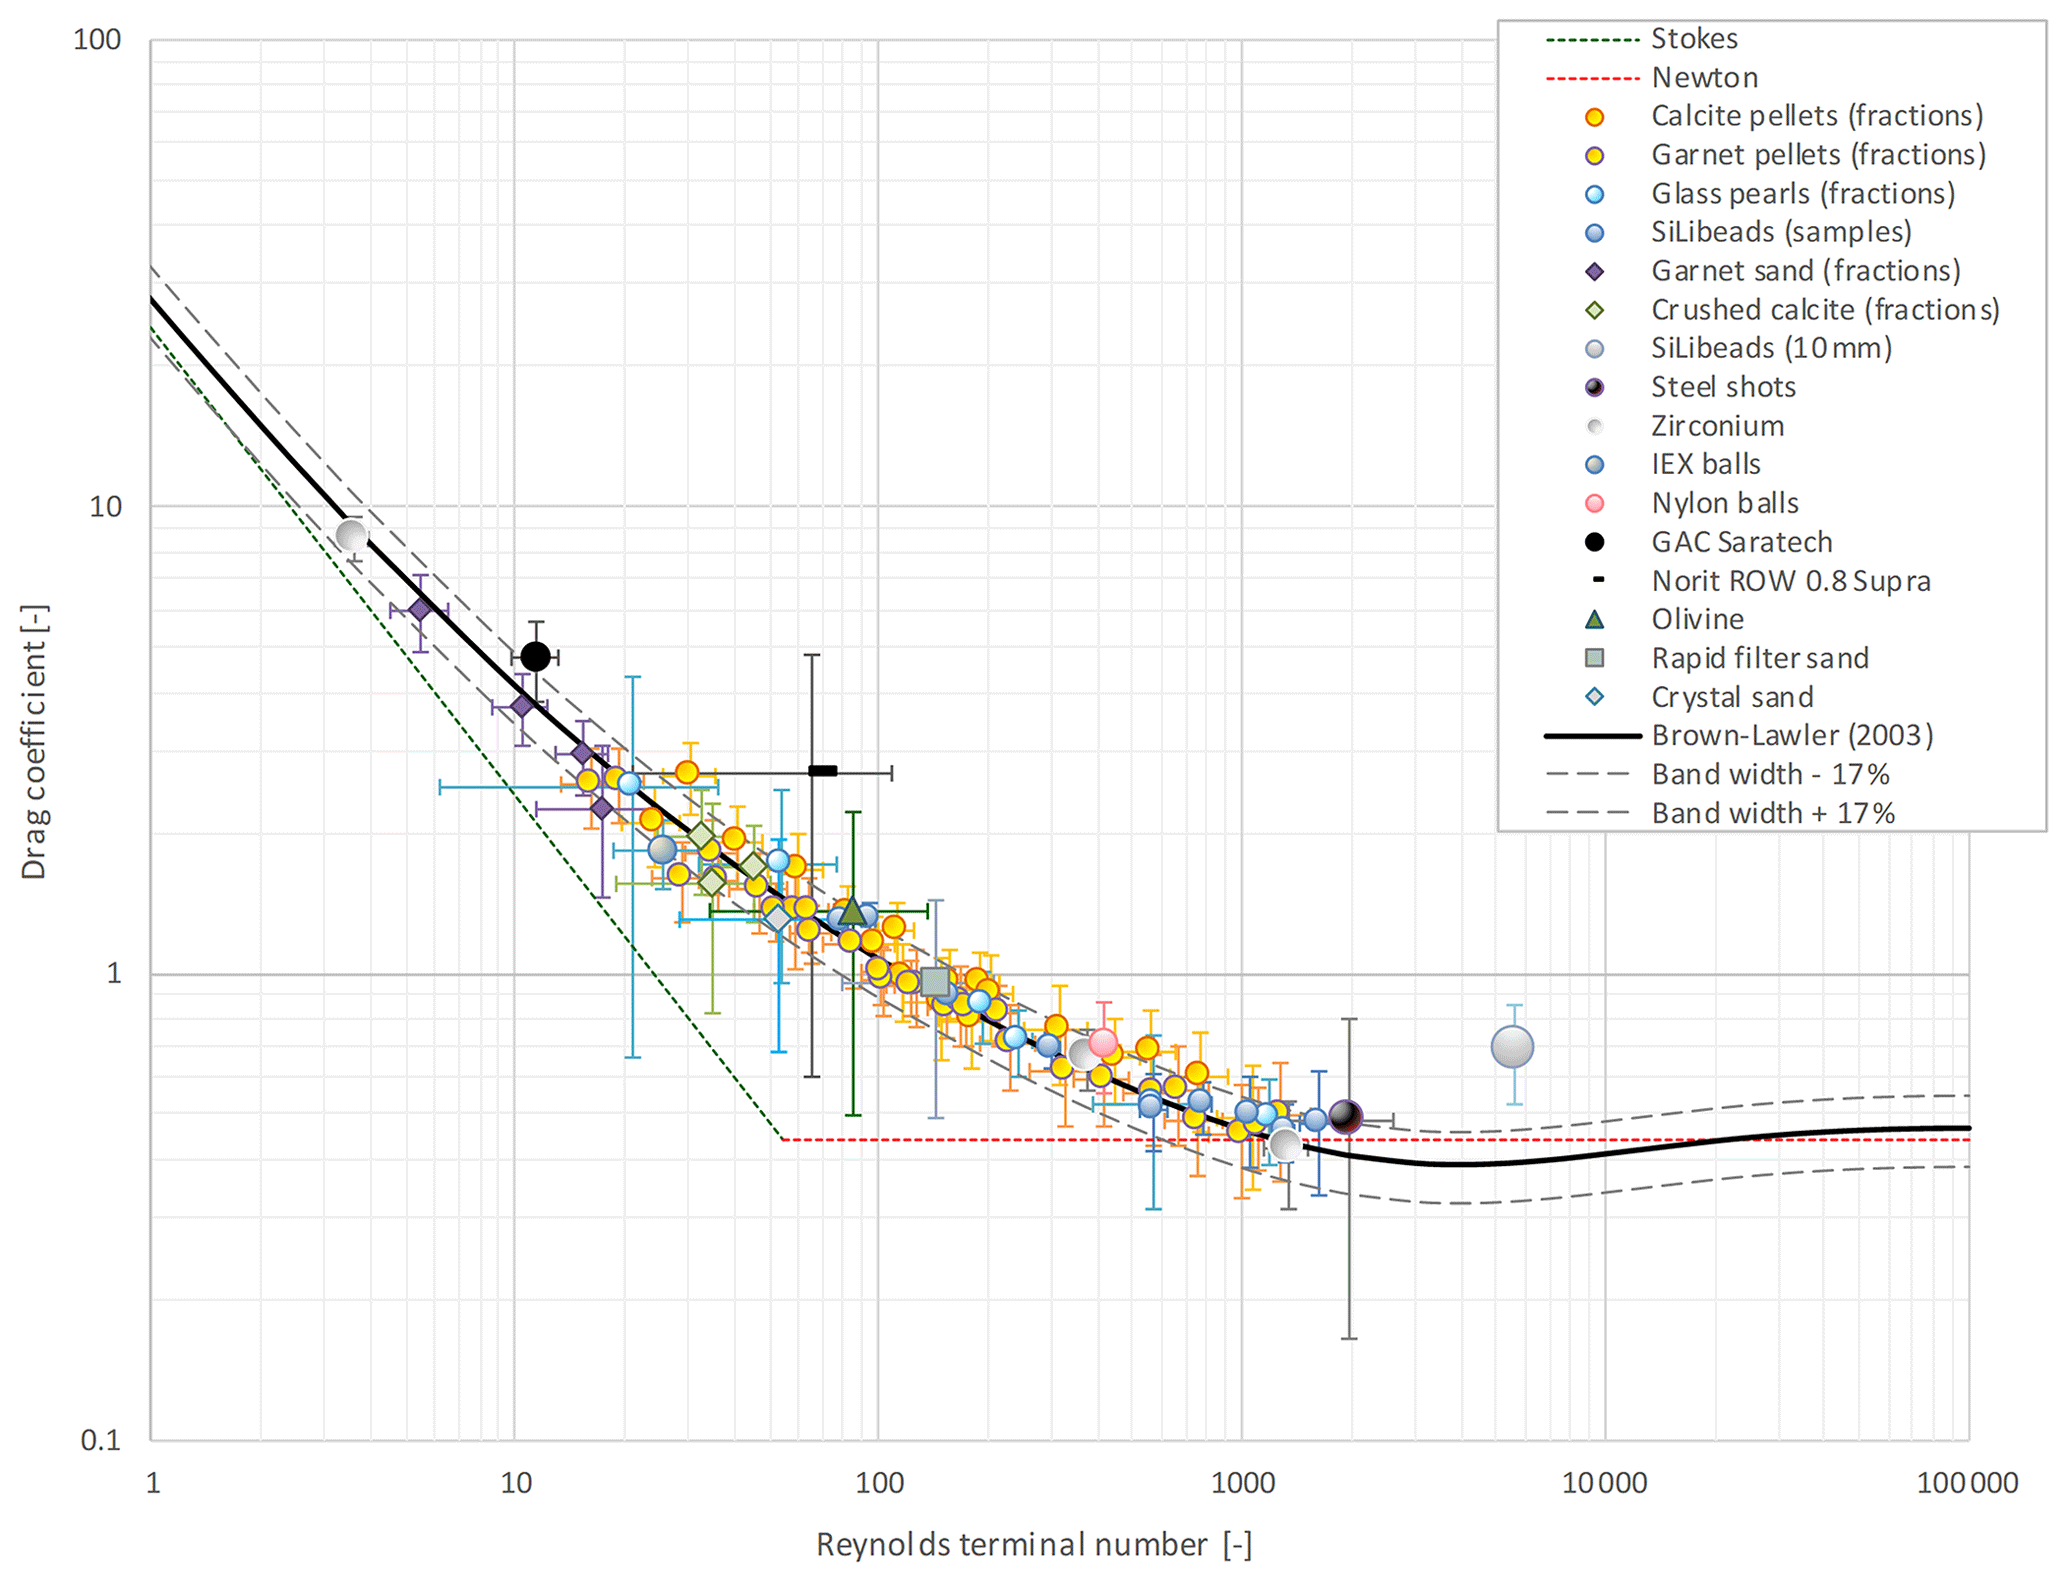
Figure 5Standard drag curve with error bars based on uncertainty analyses for 16 types of materials compared with the Brown and Lawler (2003) prediction model. A bandwidth of 35 % is added, based on a summarised propagated effect of errors on the uncertainty of the experimental measurements. Error bars for specific particle types and specific research aims (Table 2) can be found in the Supplement (Sects. S6 and S7).
Figure 5 shows typical results for the uncertainty in CD versus Ret for 16 selected particle types and expressed with error bars. Results for all other particle types and detailed derivations of the contribution to the errors can be found in the Supplement (Sects. S6 and S7).
3.3.1 Natural and processed highly non-spherical polydisperse particles
Natural irregularly shaped particles often used in water treatment processes, such as olivine, calcite, GAC grains, and several sand types, cause the largest degree of spread in the standard drag curve. CD values for GAC grains are higher compared to the calculated value, according to Brown and Lawler (2003). However, spherical GAC grains show a slightly lower spread, with an error δCD≈1. The error for the rod-shaped GAC grains is considerably larger due to the combination of a large particle size distribution (PSD), non-spherical shape, particle orientation, and particle porosity. During the experiments, it was visually observed that the GAC rods tended to settle horizontally. Additionally, they showed wobbling and zigzag behaviour.
The settling behaviour in terms of drag for olivine, crystal sand, garnet sand, and rapid filter sand is less erratic. It is notable that, particularly for rapid filter sand grains, the error in Ret is large compared to the error in CD (Haider and Levenspiel, 1989). This is mainly due to a large PSD, i.e. grains were originally mined and not sieved in advance. The non-spherical particle properties are less decisive. The observed spread for other natural grains is similar. However, for grains smaller than 0.5 mm, detecting the settling velocity became more complex and challenging.
For crushed calcite pellets, the error in CD mainly results from the grains' irregular shape caused by their processing, i.e. grinding (Schetters et al., 2015). As the grains were sieved, the PSD is less wide.
The SDC curve for natural and processed highly non-spherical polydisperse particles is given in the Supplement (Sect. S7.1).
3.3.2 Medium non-spherical polydisperse particles used in water softening
Calcite pellets were extracted from the water softening reactor, dried, and fractionated using calibrated sieves. Detailed morphological properties, such as sphericity and circularity, were also measured; these are included in the Supplement (Sect. S2). The extra information was used in the prediction models. The prediction accuracy for CD was calculated for models derived for spherical particles and for models derived for non-spherical particles. Table 5 presents the accuracy, where the symbol Φ stands for including the particles' morphological properties. No prediction model can predict the drag coefficient with an error level below 10 %. The best results are obtained by the classical Haider and Levenspiel (1989) model and, with a slightly lower score, the Brown and Lawler (2003) model.
Table 5Drag coefficient prediction accuracy for calcite pellets (0.36 < dp < 2.8 mm) based on individual terminal settling experiments (N=1163).
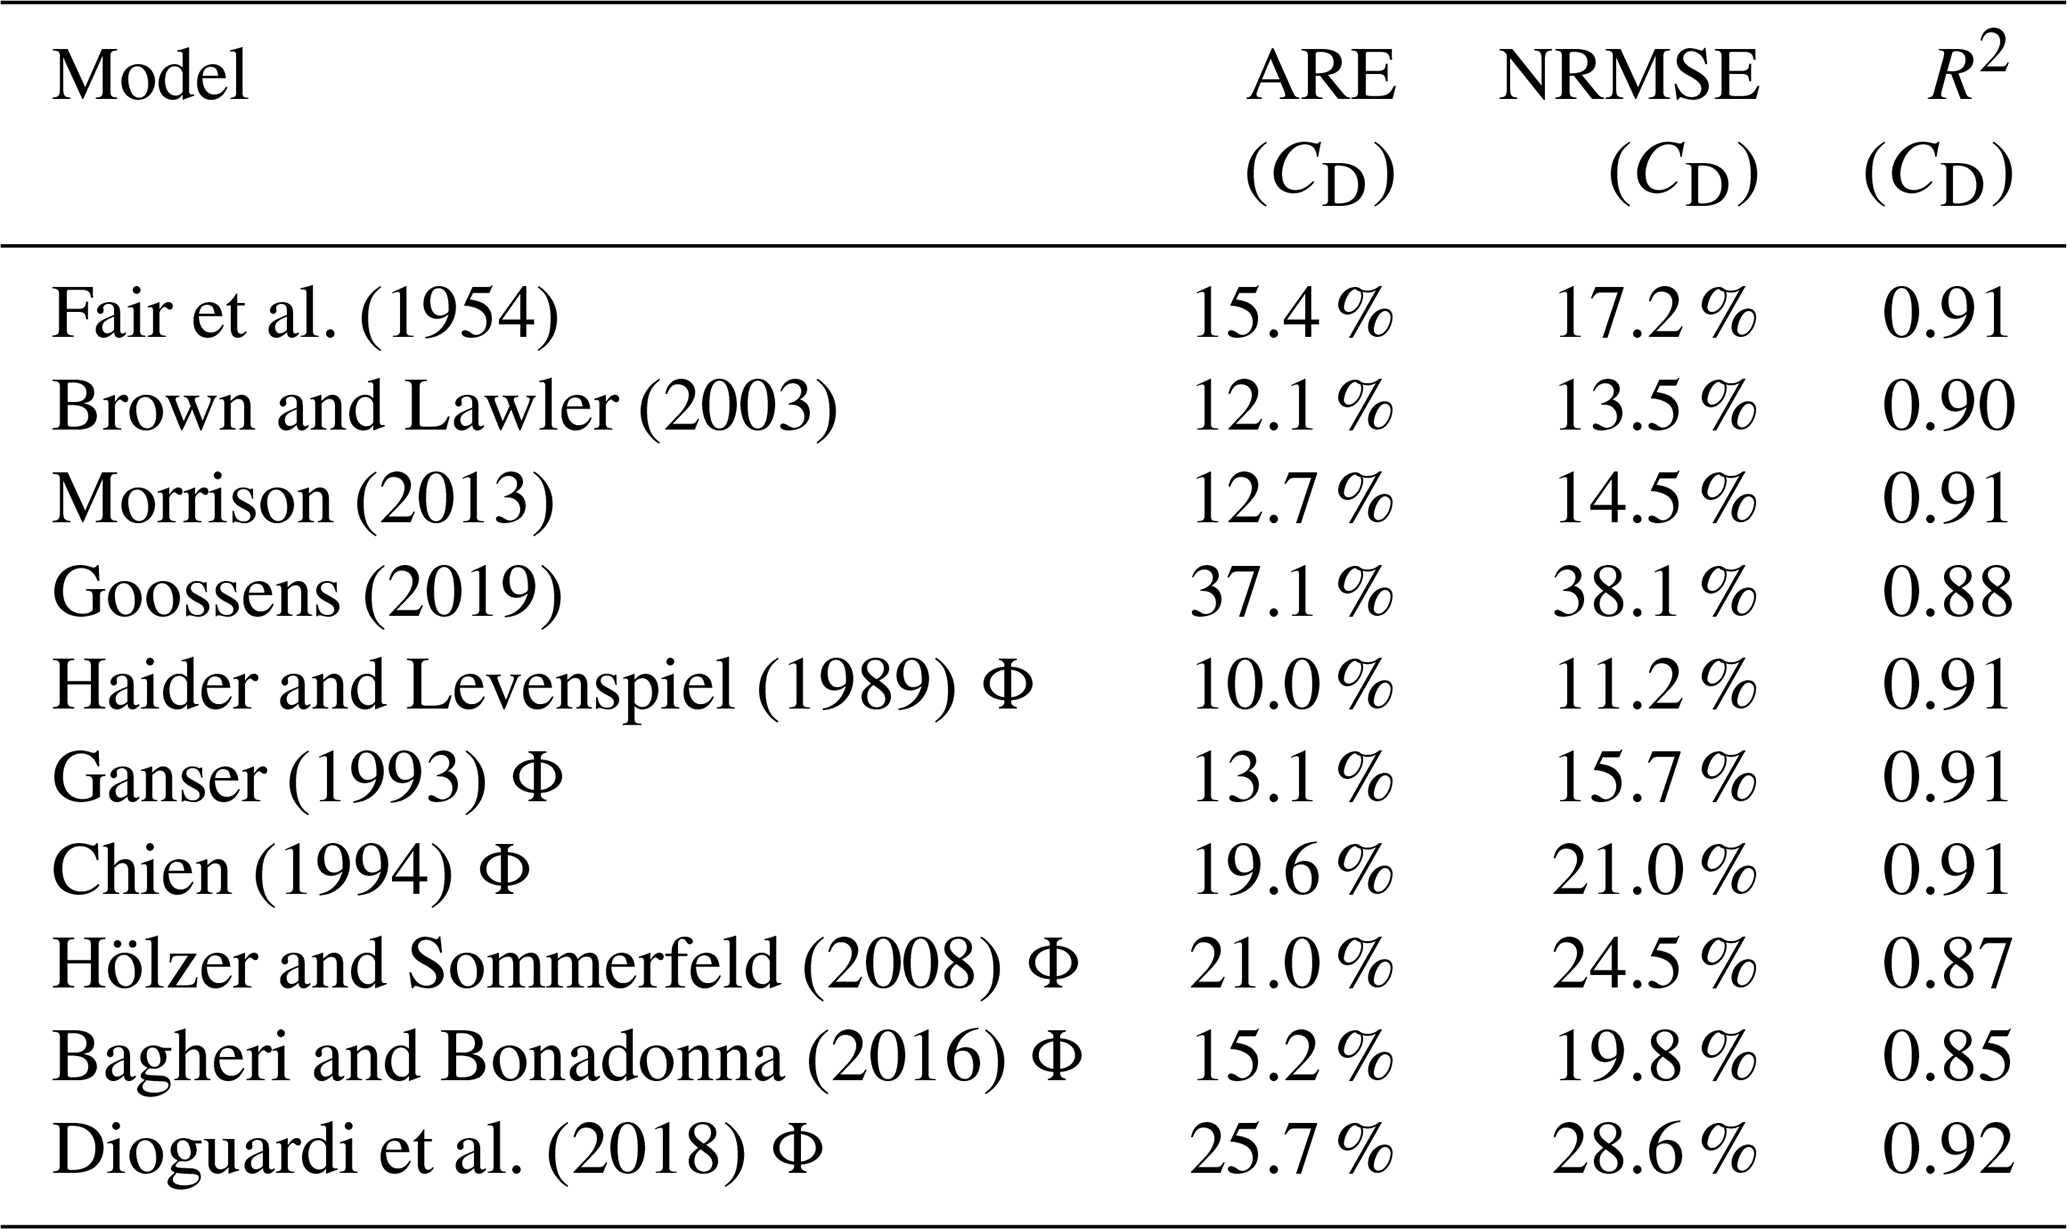
Figure 6 presents the average CD values for calcite pellets where, from a visual perspective, the dots show a reasonable fit with the majority of the models. The error bars clearly show that the variation in the measured data constrains the prediction accuracy. Detailed morphological data of calcite pellets and crushed calcite and the standard drag curve for natural and processed highly non-spherical polydisperse particles are given in the Supplement (Sects. S2 and S7.2).
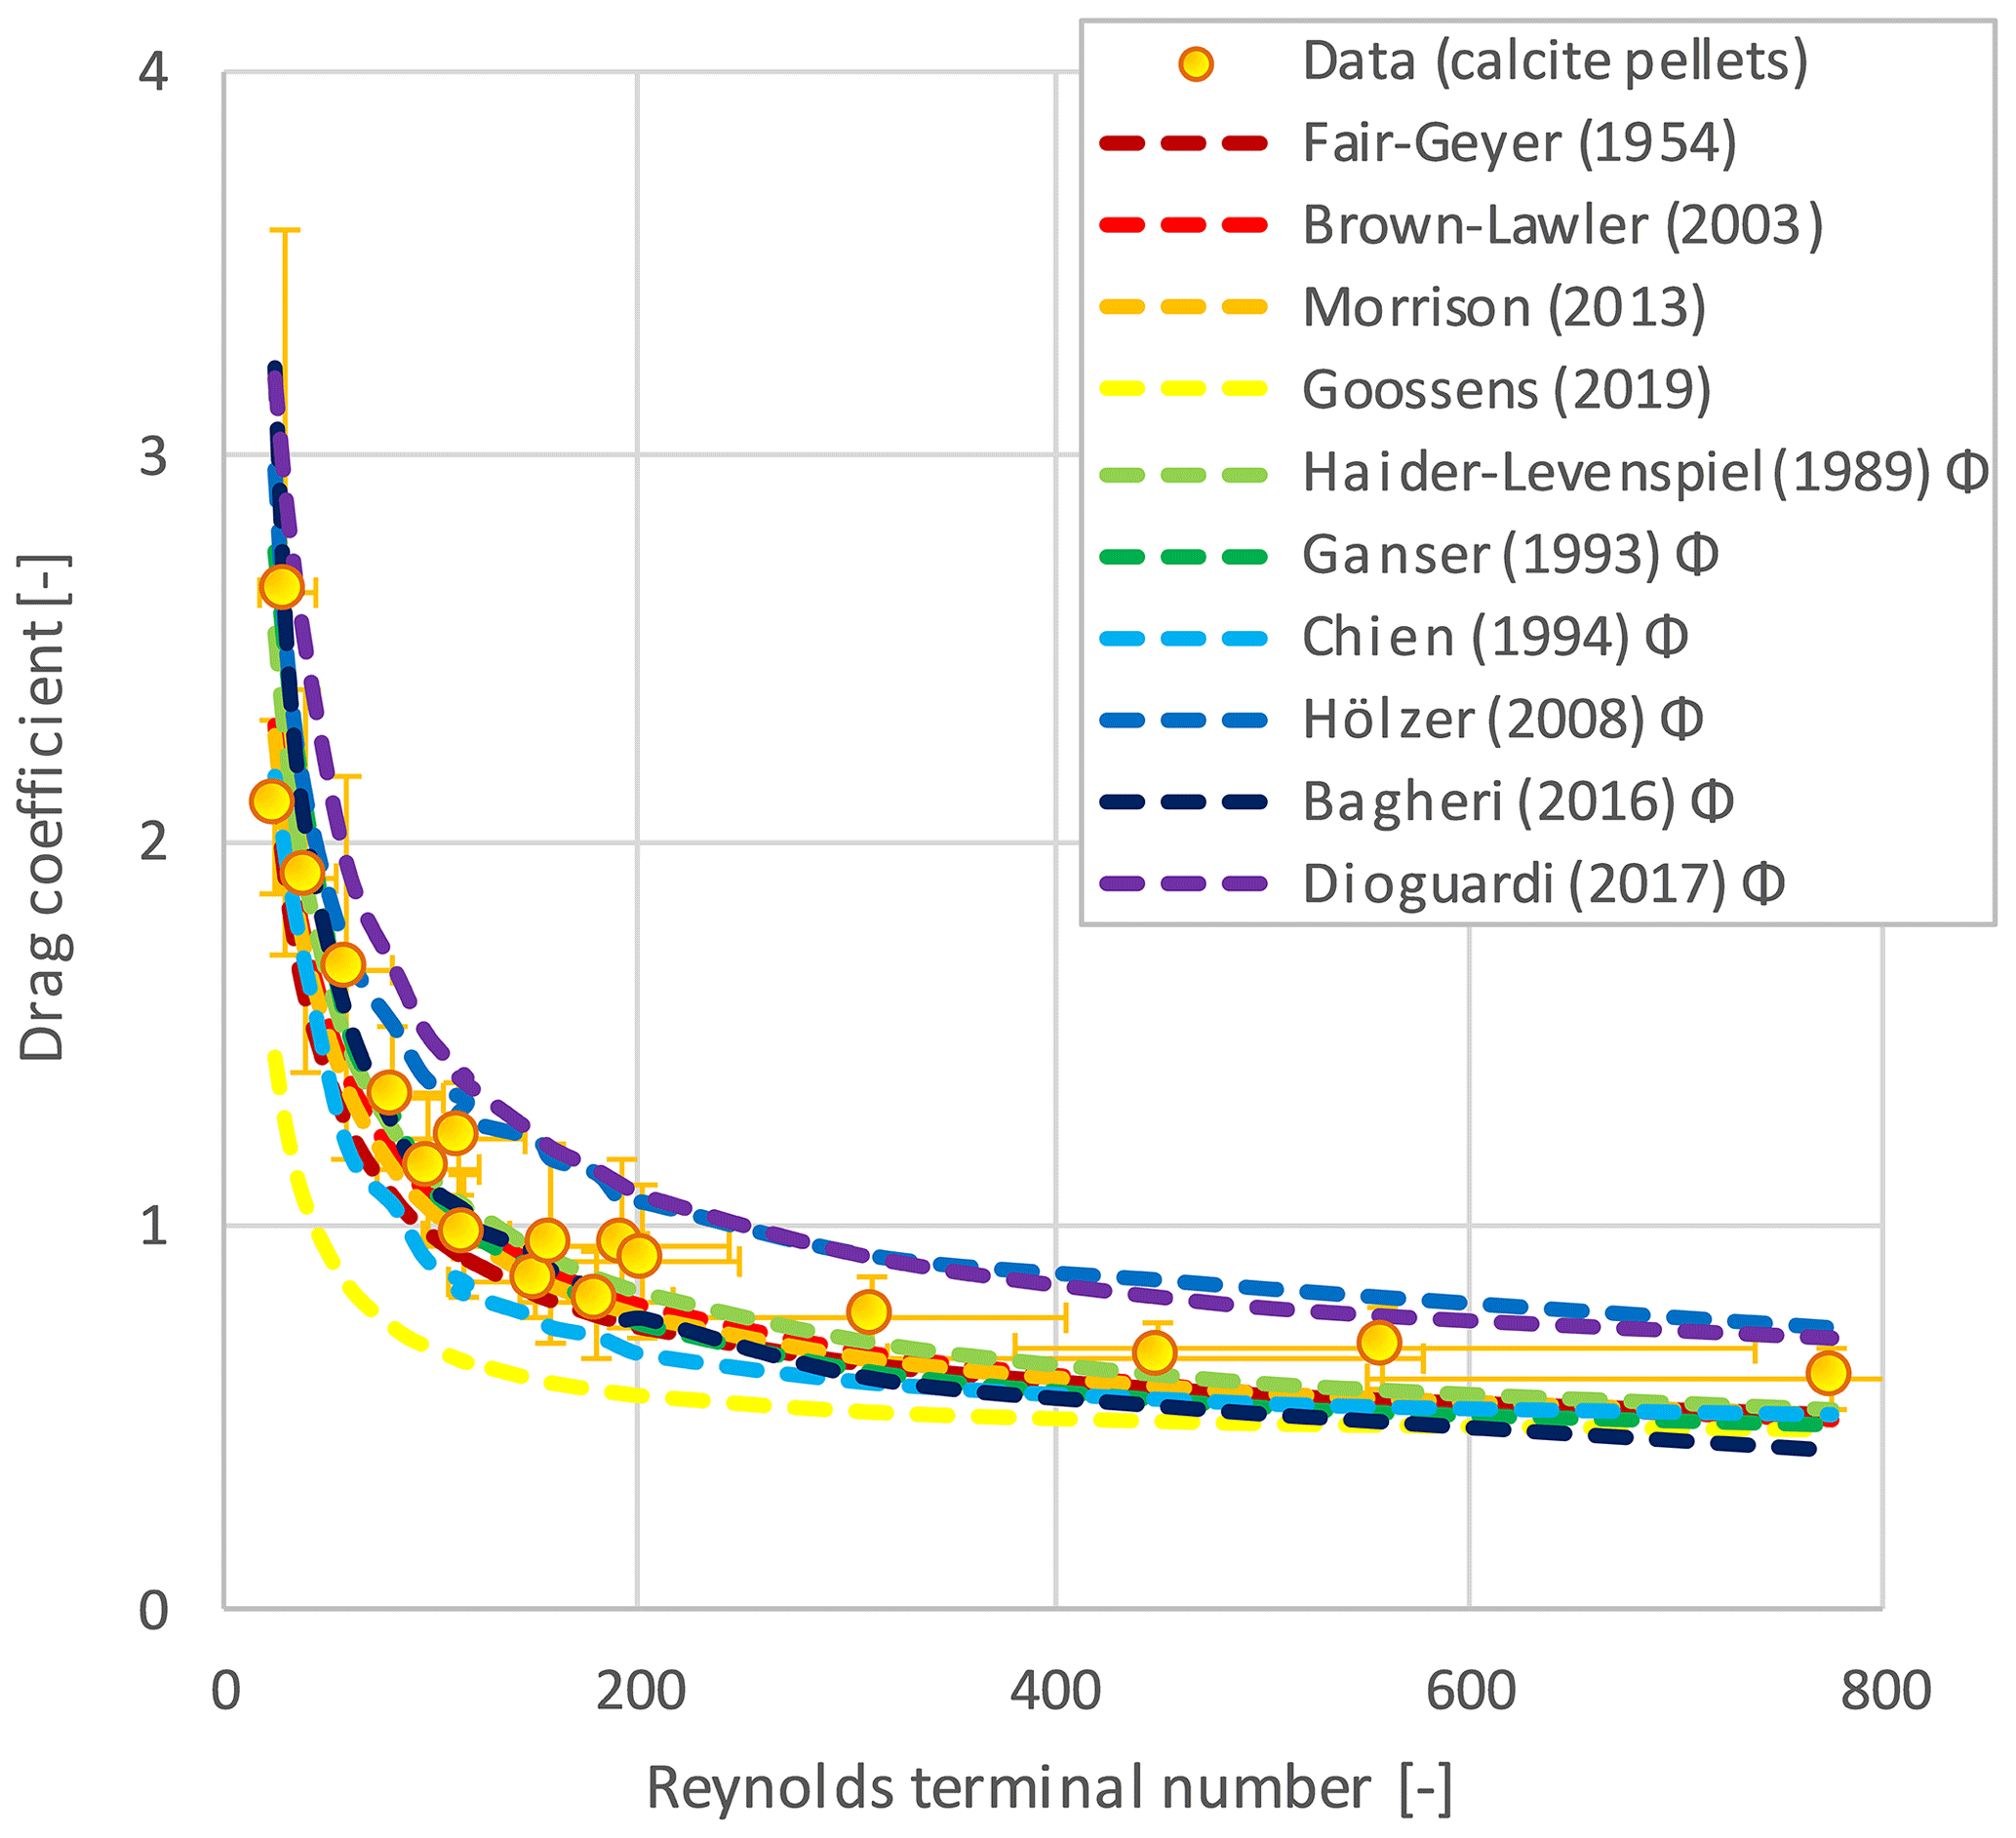
Figure 6Drag coefficient prediction (average values on a linear–linear (lin–lin) scale) accuracy for calcite pellets (0.36 < dp < 2.8 mm), including (measured) error bars based on individual terminal settling experiments (N=1163). Φ indicates that the measured sphericity is included in the model.
3.3.3 Highly spherical polydisperse and monodisperse glass beads
In the literature, glass beads are popular and frequently used for model calibration and validation purposes. In this work, 288 individual spherical glass pearls were settled. The CD values show reasonable agreement with the Brown and Lawler (2003) curve. Data spread is caused by polydispersity (UC>1), albeit less pronounced than for calcite pellets. A whole sequence of highly spherical (Φ→1) monodisperse (UC→1) glass beads (N=911) was studied in terms of their settling behaviour. For these particles, diagonal trends in the SDC plots were noticeable, despite the fact that the average CD coincides fairly well with the Brown and Lawler (2003) curve. These trends are related to the way the estimated drag coefficient depends on the measured settling velocity (Eq. 4) and have been observed by Veldhuis et al. (2009) and Raaghav (2019). The slope in the standard drag curve equals approximately −2, corresponding to . A mathematical basis for this trend is explained in the Supplement, with the help of a simple scaling analysis (Sect. S10) and the SDC curve (Sect. S7.3).
3.3.4 Repetitive experiment with highly spherical monodisperse single glass beads
To eliminate the human factor, one sequence was executed where one and the same single glass bead (dp=3 mm) was used 30 times. The start and end times were filmed, and hence the error in δt and δL was negligible. We observed that the spread in CD decreased when human error was excluded. Nevertheless, similar to spherical monodisperse glass beads, the previously observed trend (slope −2) was observed. The SDC curves for highly spherical polydisperse and monodisperse single glass beads are given in the Supplement (Sect. S7.4).
3.3.5 Highly spherical monodisperse glass beads and wall effects
In addition to the highly spherical monodisperse glass beads, larger glass beads (dp=10 mm) were tested in a small cylindrical column (D=57 mm). In this particular case, wall effects evidently played a role in the retardation of the terminal settling velocity. In addition, it became apparent during the experiments that the glass beads tended to move to the wall, followed by a prominent zigzag movement due to side drifting motions caused by a high Galileo number (Zhou and Dušek, 2015). The Galileo number is expressed in Eq. (5) as follows:
Note that the majority of the literature which addresses path instabilities use the Galileo number based on the regime map (Jenny et al., 2004; Veldhuis and Biesheuvel, 2007; Zhou and Dušek, 2015) and not the Archimedes number (Karamanev, 1996).
In the standard drag curve, CD is higher compared to the Brown and Lawler (2003) curve, but this can be attributed to wall effects and non-vertical settling trajectories. Wall effect correction equations given by Di Felice and Gibilaro (2004), Gibilaro et al. (1985), and Chhabra et al. (2003), which are often empirically based, could not compensate for these non-ideal phenomena and circumstances. The SDC curve and a video fragment illustrating the wall effects for a highly spherical monodisperse glass bead are given in the Supplement (Sect. S7.5).
3.3.6 Highly spherical monodisperse glass beads in different columns and with different fall lengths
To explore the influence of the column diameter, the same experiments were executed in two columns with different sizes (D=57 mm and D=125 mm) for three different glass bead sizes (1.5, 2.5, and 3.5 mm). The successive experiments aimed to determine whether the fall length plays a role. An important aspect here is that the settling velocity was measured merely in a steady state situation. Based on the results and figures given in the Supplement (Sects. S7.6 and S7.7), no distinction can be made.
3.3.7 Highly spherical polydisperse synthetic particles
Spherical polydisperse particles with a low particle to fluid density ratio () have a similar settling behaviour. Nylon balls and IEX resin balls are spherical and have a relatively high uniformity coefficient. IEX balls are more polydisperse compared to nylon balls and show more spread in CD. The SDC curve for highly spherical polydisperse synthetic particles is given in the Supplement (Sect. S7.8).
3.3.8 Highly spherical monodisperse metal balls
The outside layer of the examined zirconium balls is ZrO2, so the surface is not smooth. To investigate if this affects the drag, we tested highly spherical, monodisperse zirconium balls with three different sizes (0.1, 1.0, and 2.0 mm). The individual measured drag coincides well with the Brown and Lawler (2003) curve. Generally speaking, surface roughness can cause the boundary layer to become turbulent and the wake region behind the sphere to become considerably narrower than if it were laminar, which results in a considerable drop in pressure drag with a slight increase in friction drag (Munson et al., 2020; Loth, 2008; Bagheri and Bonadonna, 2016). Nevertheless, the influence of particle surface roughness on the drag coefficient for the Reynolds number (Ret < 40 000) can be neglected. The range for the Reynolds number in this work for all experimental data is 1.2 < Ret < 7500; surface roughness effects were not found and therefore further neglected.
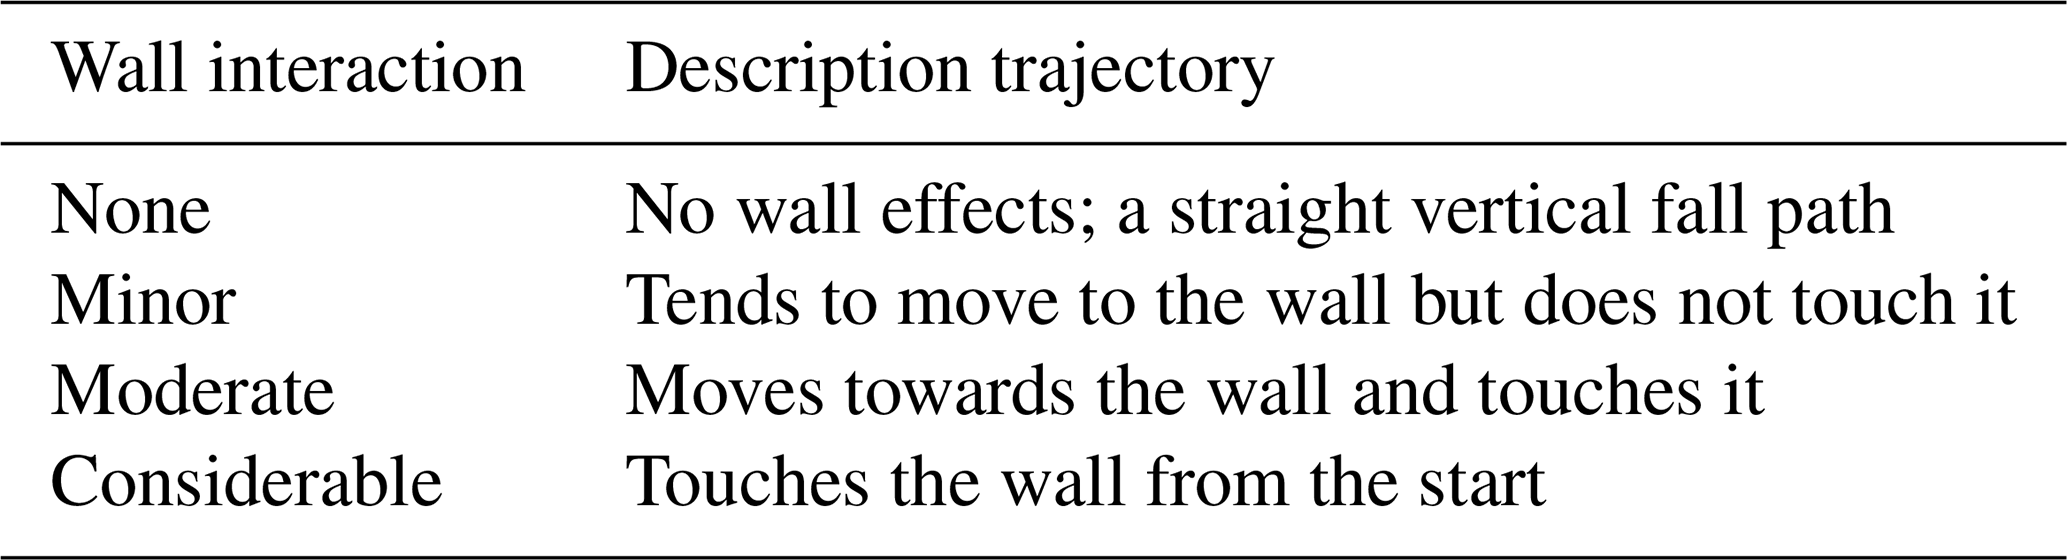
Additionally, the settling behaviour of highly spherical and monodisperse metal balls (dp=3 mm) with a high particle to fluid density ratio () was studied in a cylindrical column (D=125 mm). Based on the average measured CD, the experimental drag was 7 % smaller than the Newton constant drag (CD = 0.44), but 20 % above the Brown and Lawler (2003) predicted value in this particular range of the Reynolds number. The measured drag had a small calculated spread (). The experiments, however, prove the existence of a substantial discrepancy at the individual level. We observed four different settling behaviours and path trajectories (Table 6). An average drag coefficient was determined for N=35 individual measurements. Nonetheless, a lower was determined for metal balls with a vertical path trajectory, and was determined for particles which tended to move to the wall but did not touch it. For particles that came into contact with the wall of the tube, a significantly higher was found. In this particular case, the wall effect, causing the retardation of the settling velocity due to water displacement, is another factor to be considered. Here, the wall effect implies wall contact interactions. Similar to what was found for 10 mm glass beads, we observed a vertical bouncing effect on the wall caused by a chaotic zigzag fall trajectory (Zhou and Dušek, 2015).
The SDC curves for highly spherical monodisperse metal balls are given in the Supplement (Sect. S7.9).
3.4 Path trajectories
The path trajectories of fractionated calcite pellets (1.0–2.8 mm) were recorded using an advanced experimental set-up. Figures 7 and 8 present the path trajectories of single calcite pellets, demonstrating the non-linear fall trajectory of grains.
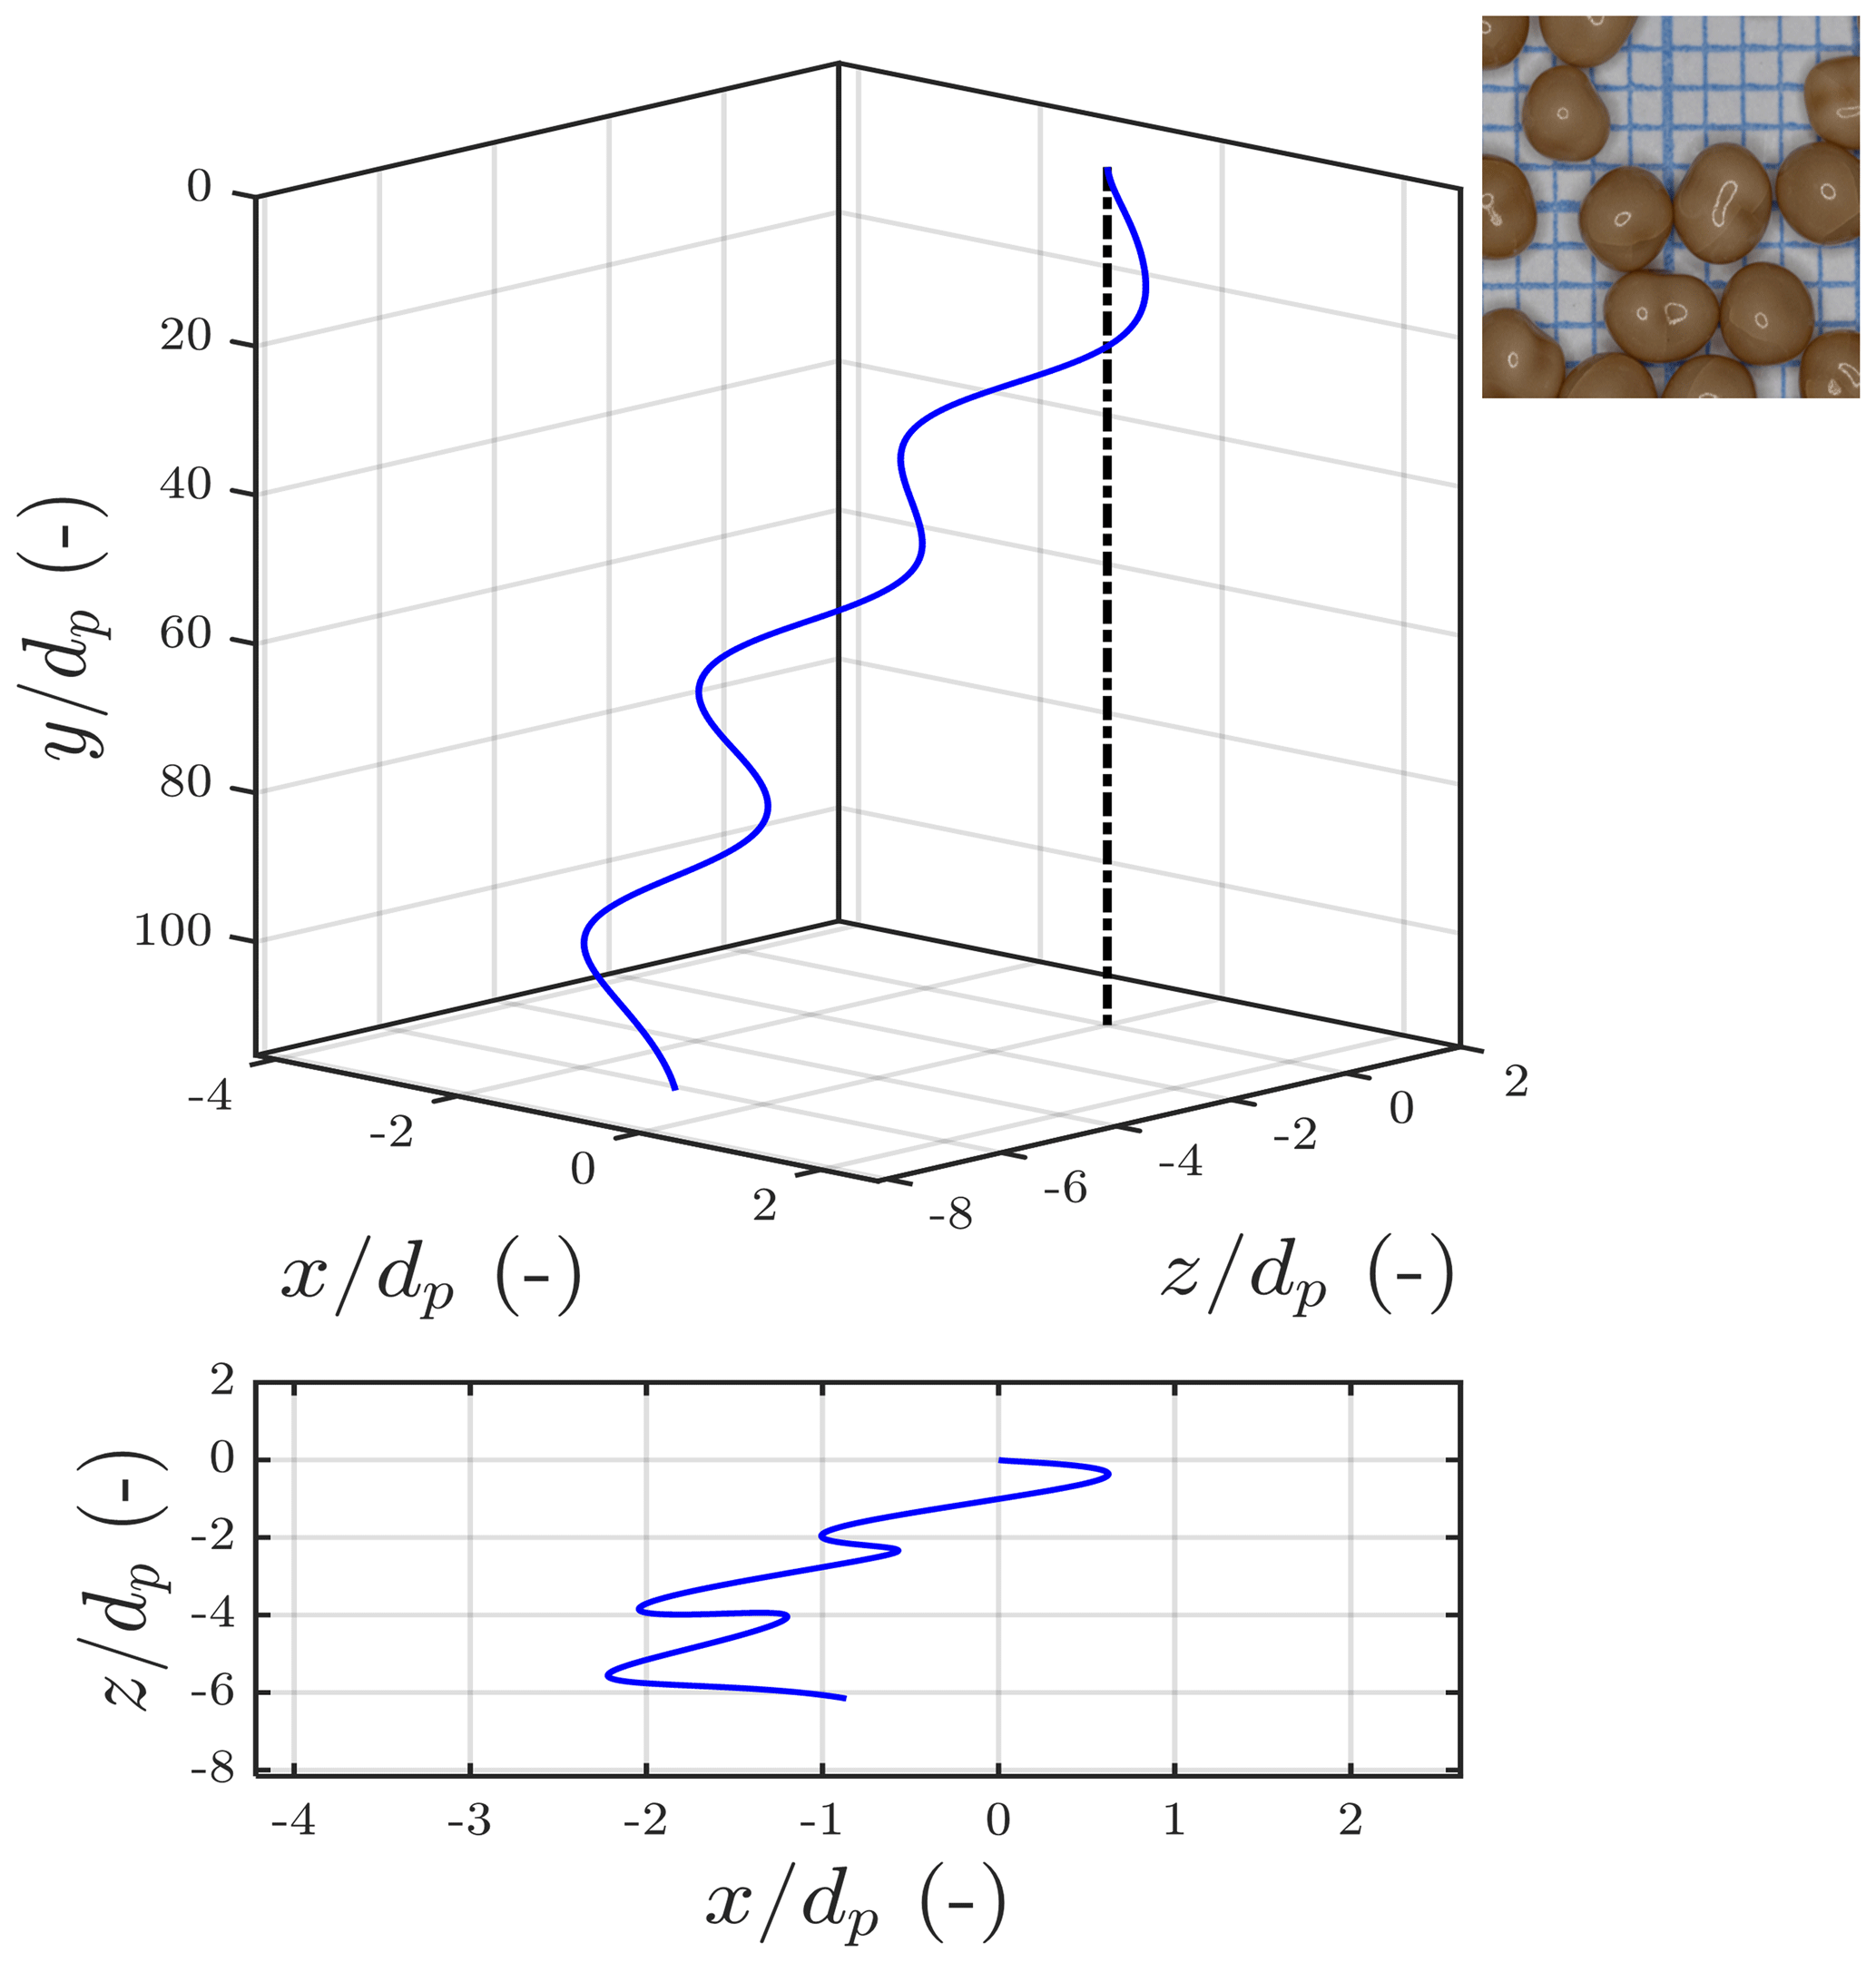
Figure 7Calcite pellets = 2.36 < dp < 2.8 mm, T=20 ∘C, CD=0.55, , Ret=809, Ga=522, vt=0.32, , angle = 2.8∘, and %, and path = CH.
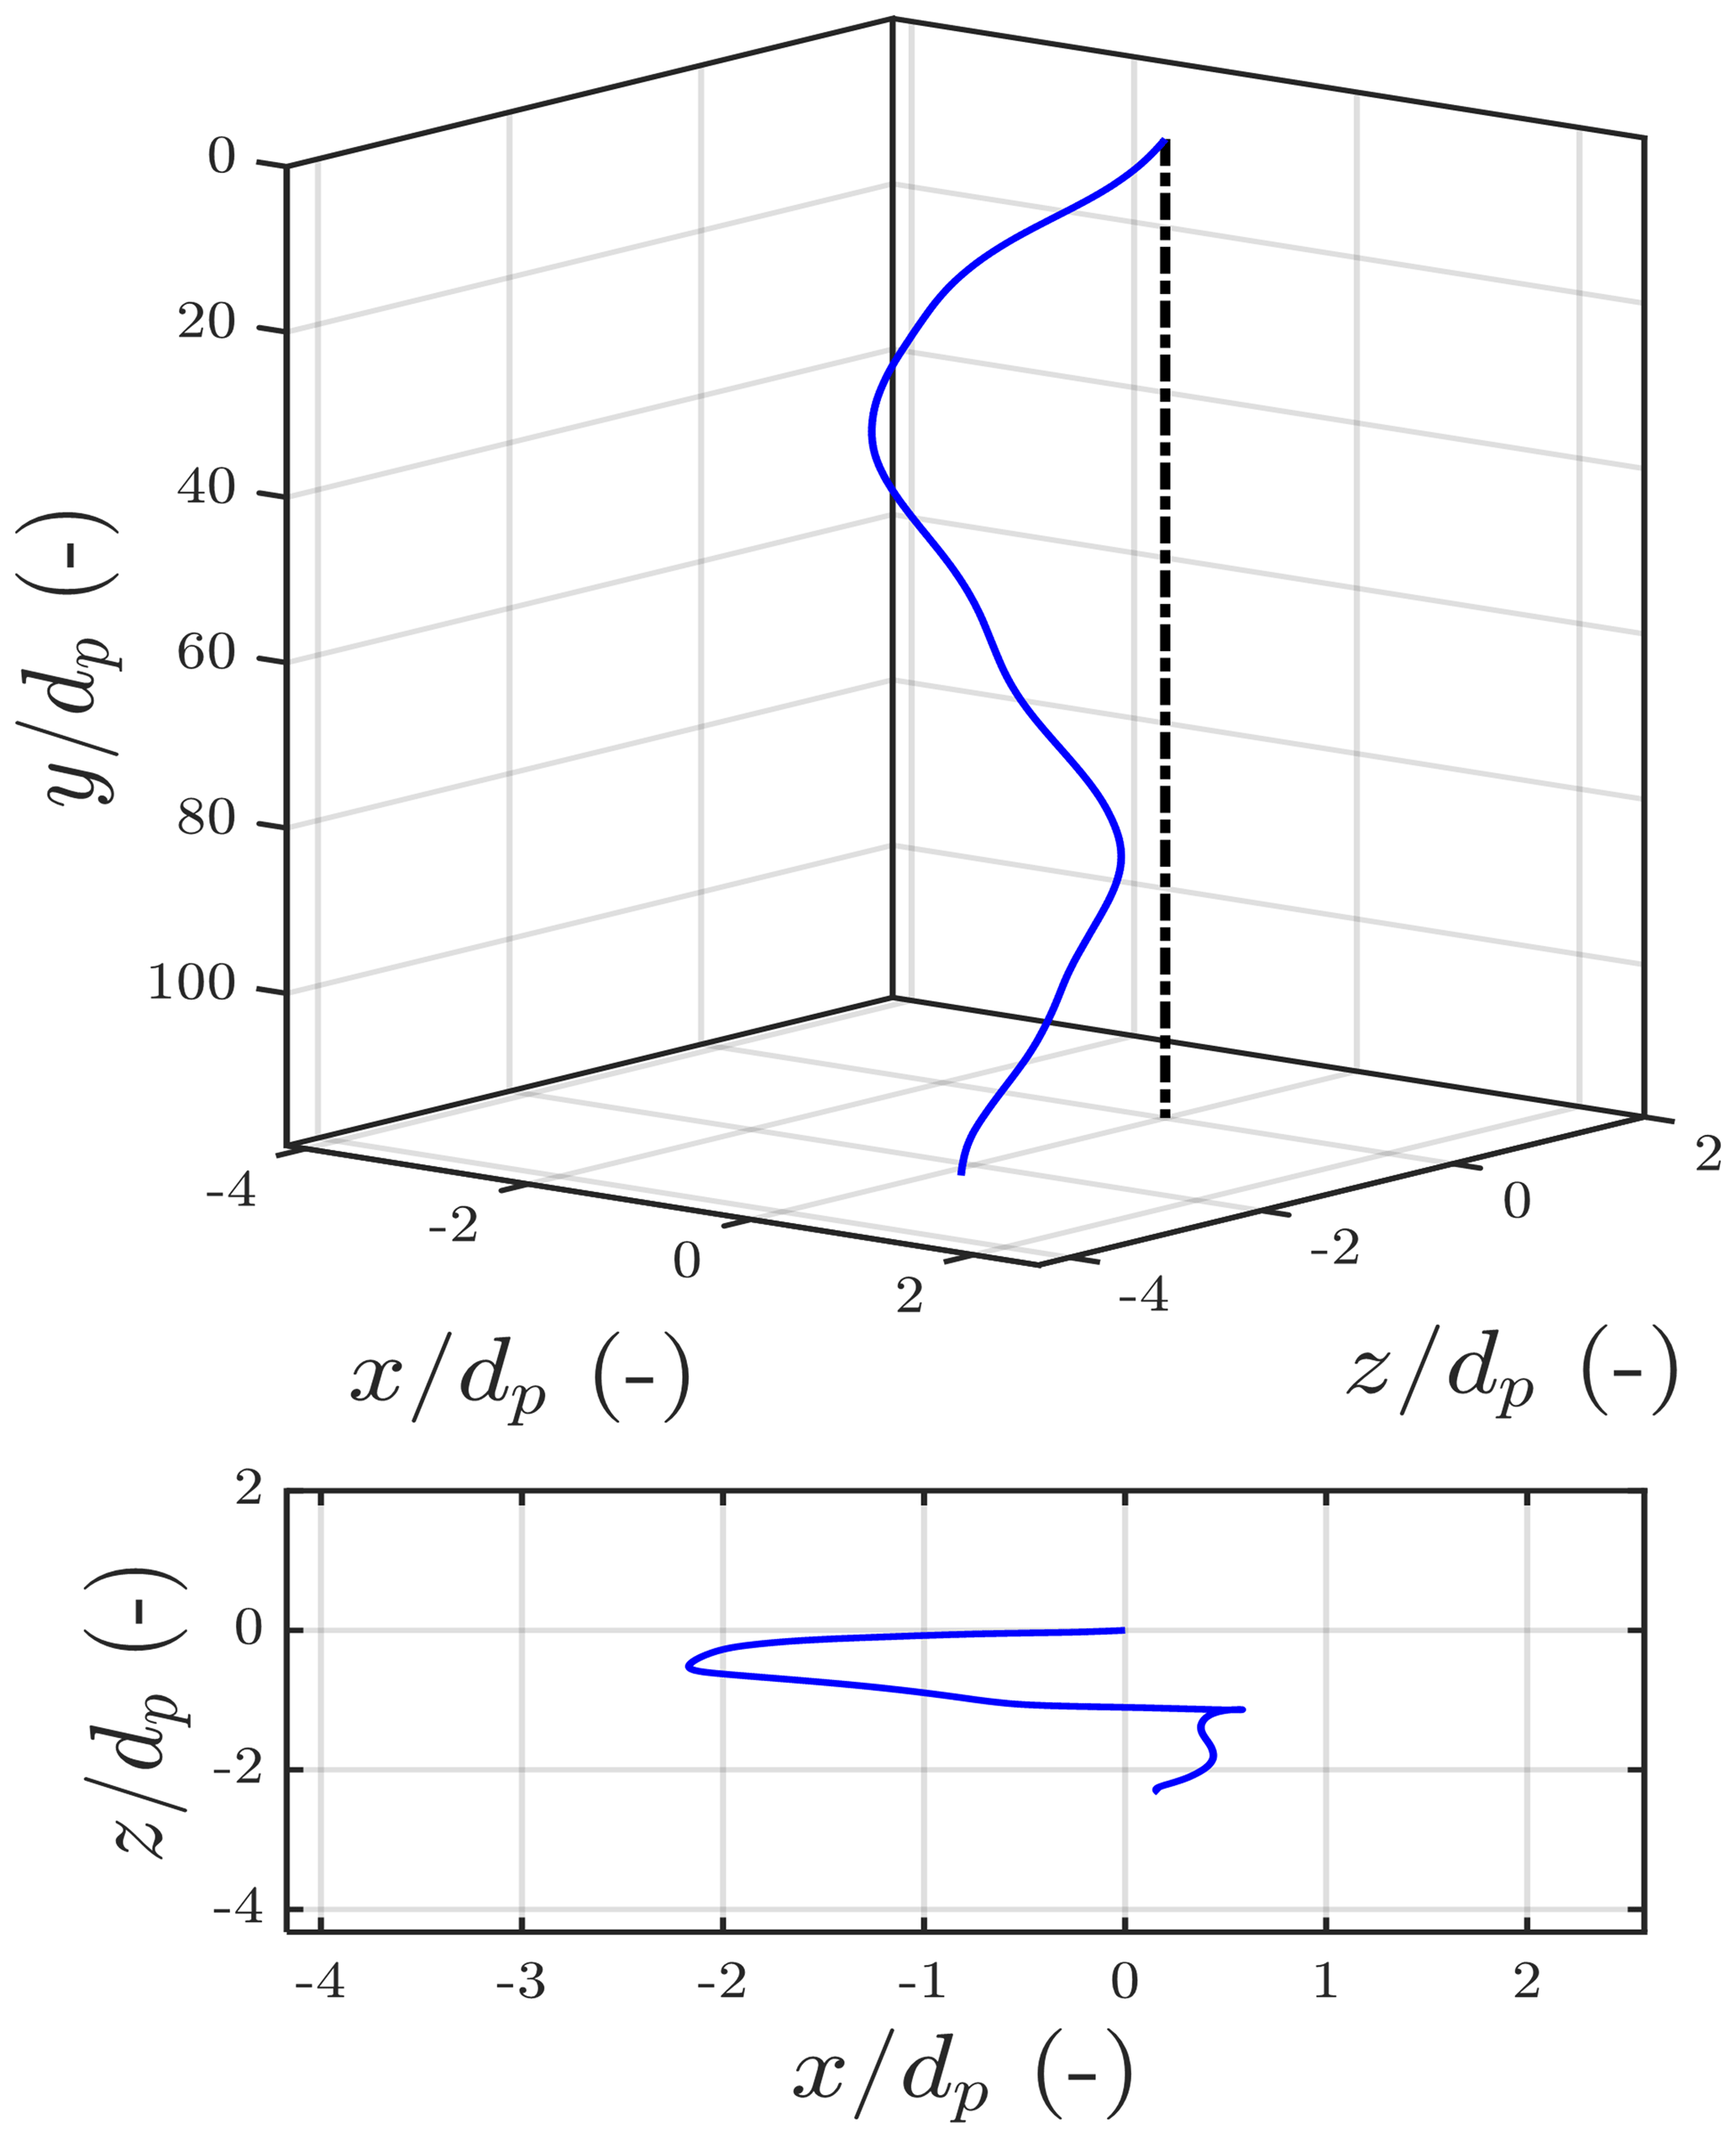
Figure 8Calcite pellets = 2.36 < dp < 2.8, T=20 ∘C, CD=0.57, , Ret=800, Ga=522, vt=0.32, , angle = 2.1∘, and %, and path = CH.
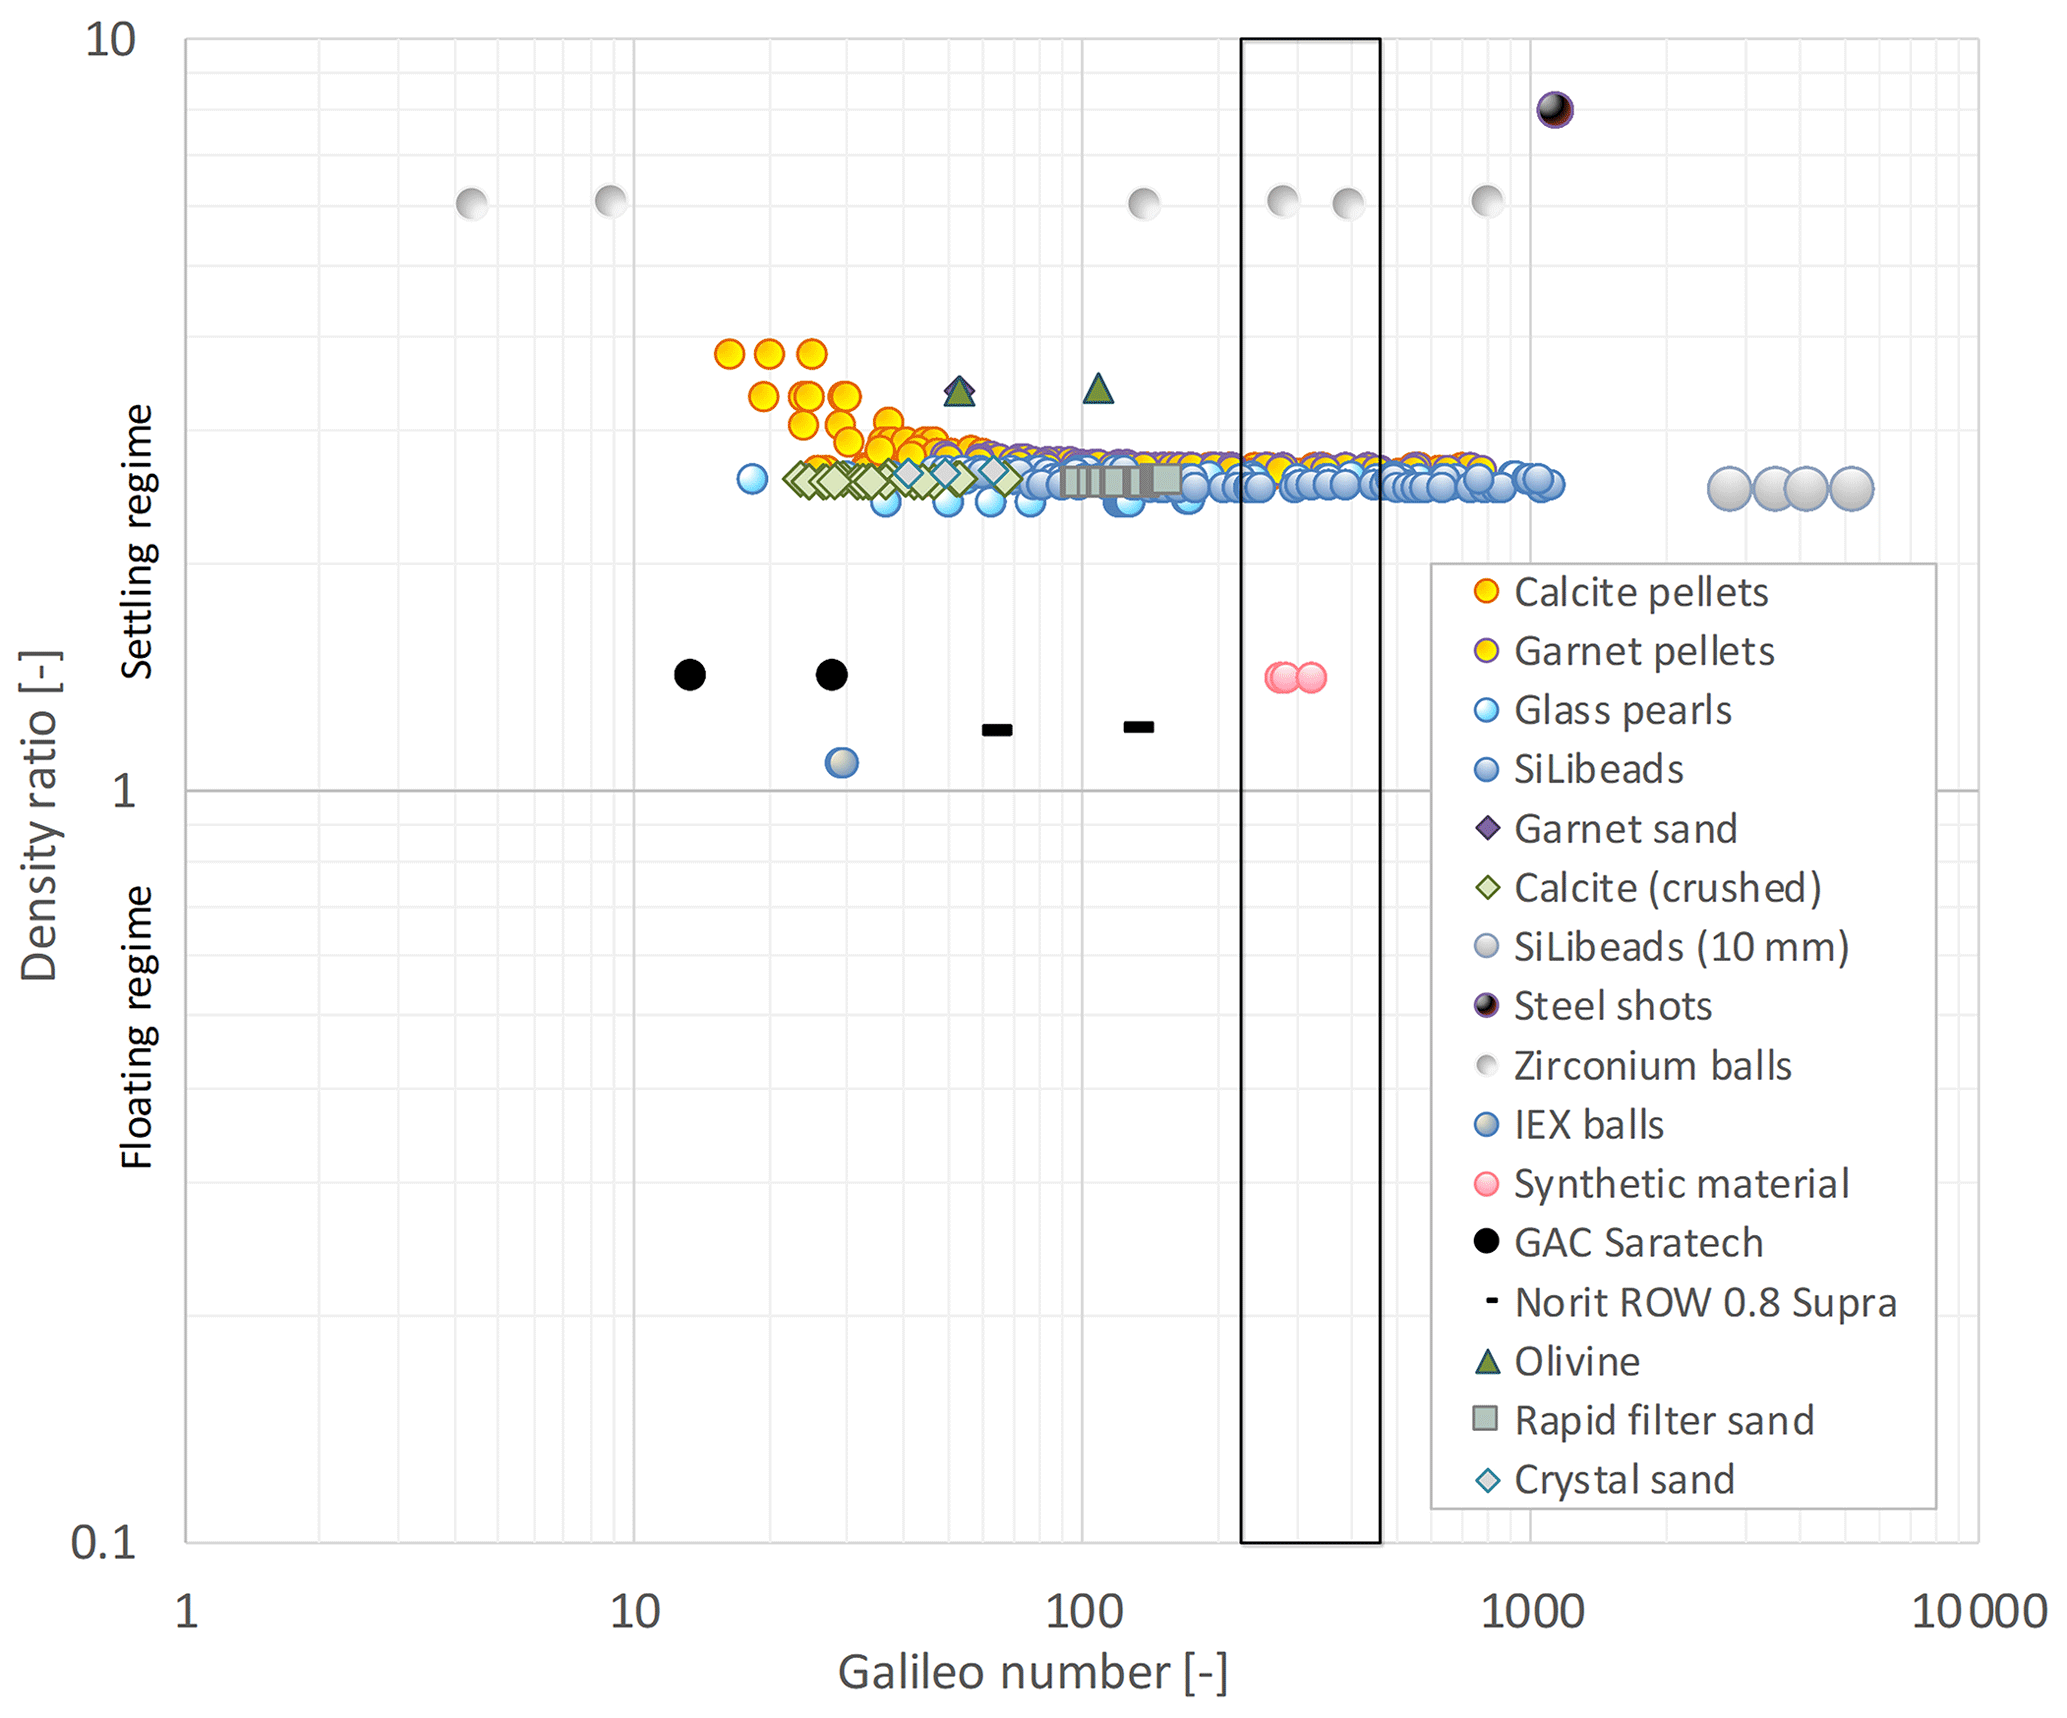
Figure 9State diagram. Galileo number, Ga, versus specific gravity number, , with examined particles.
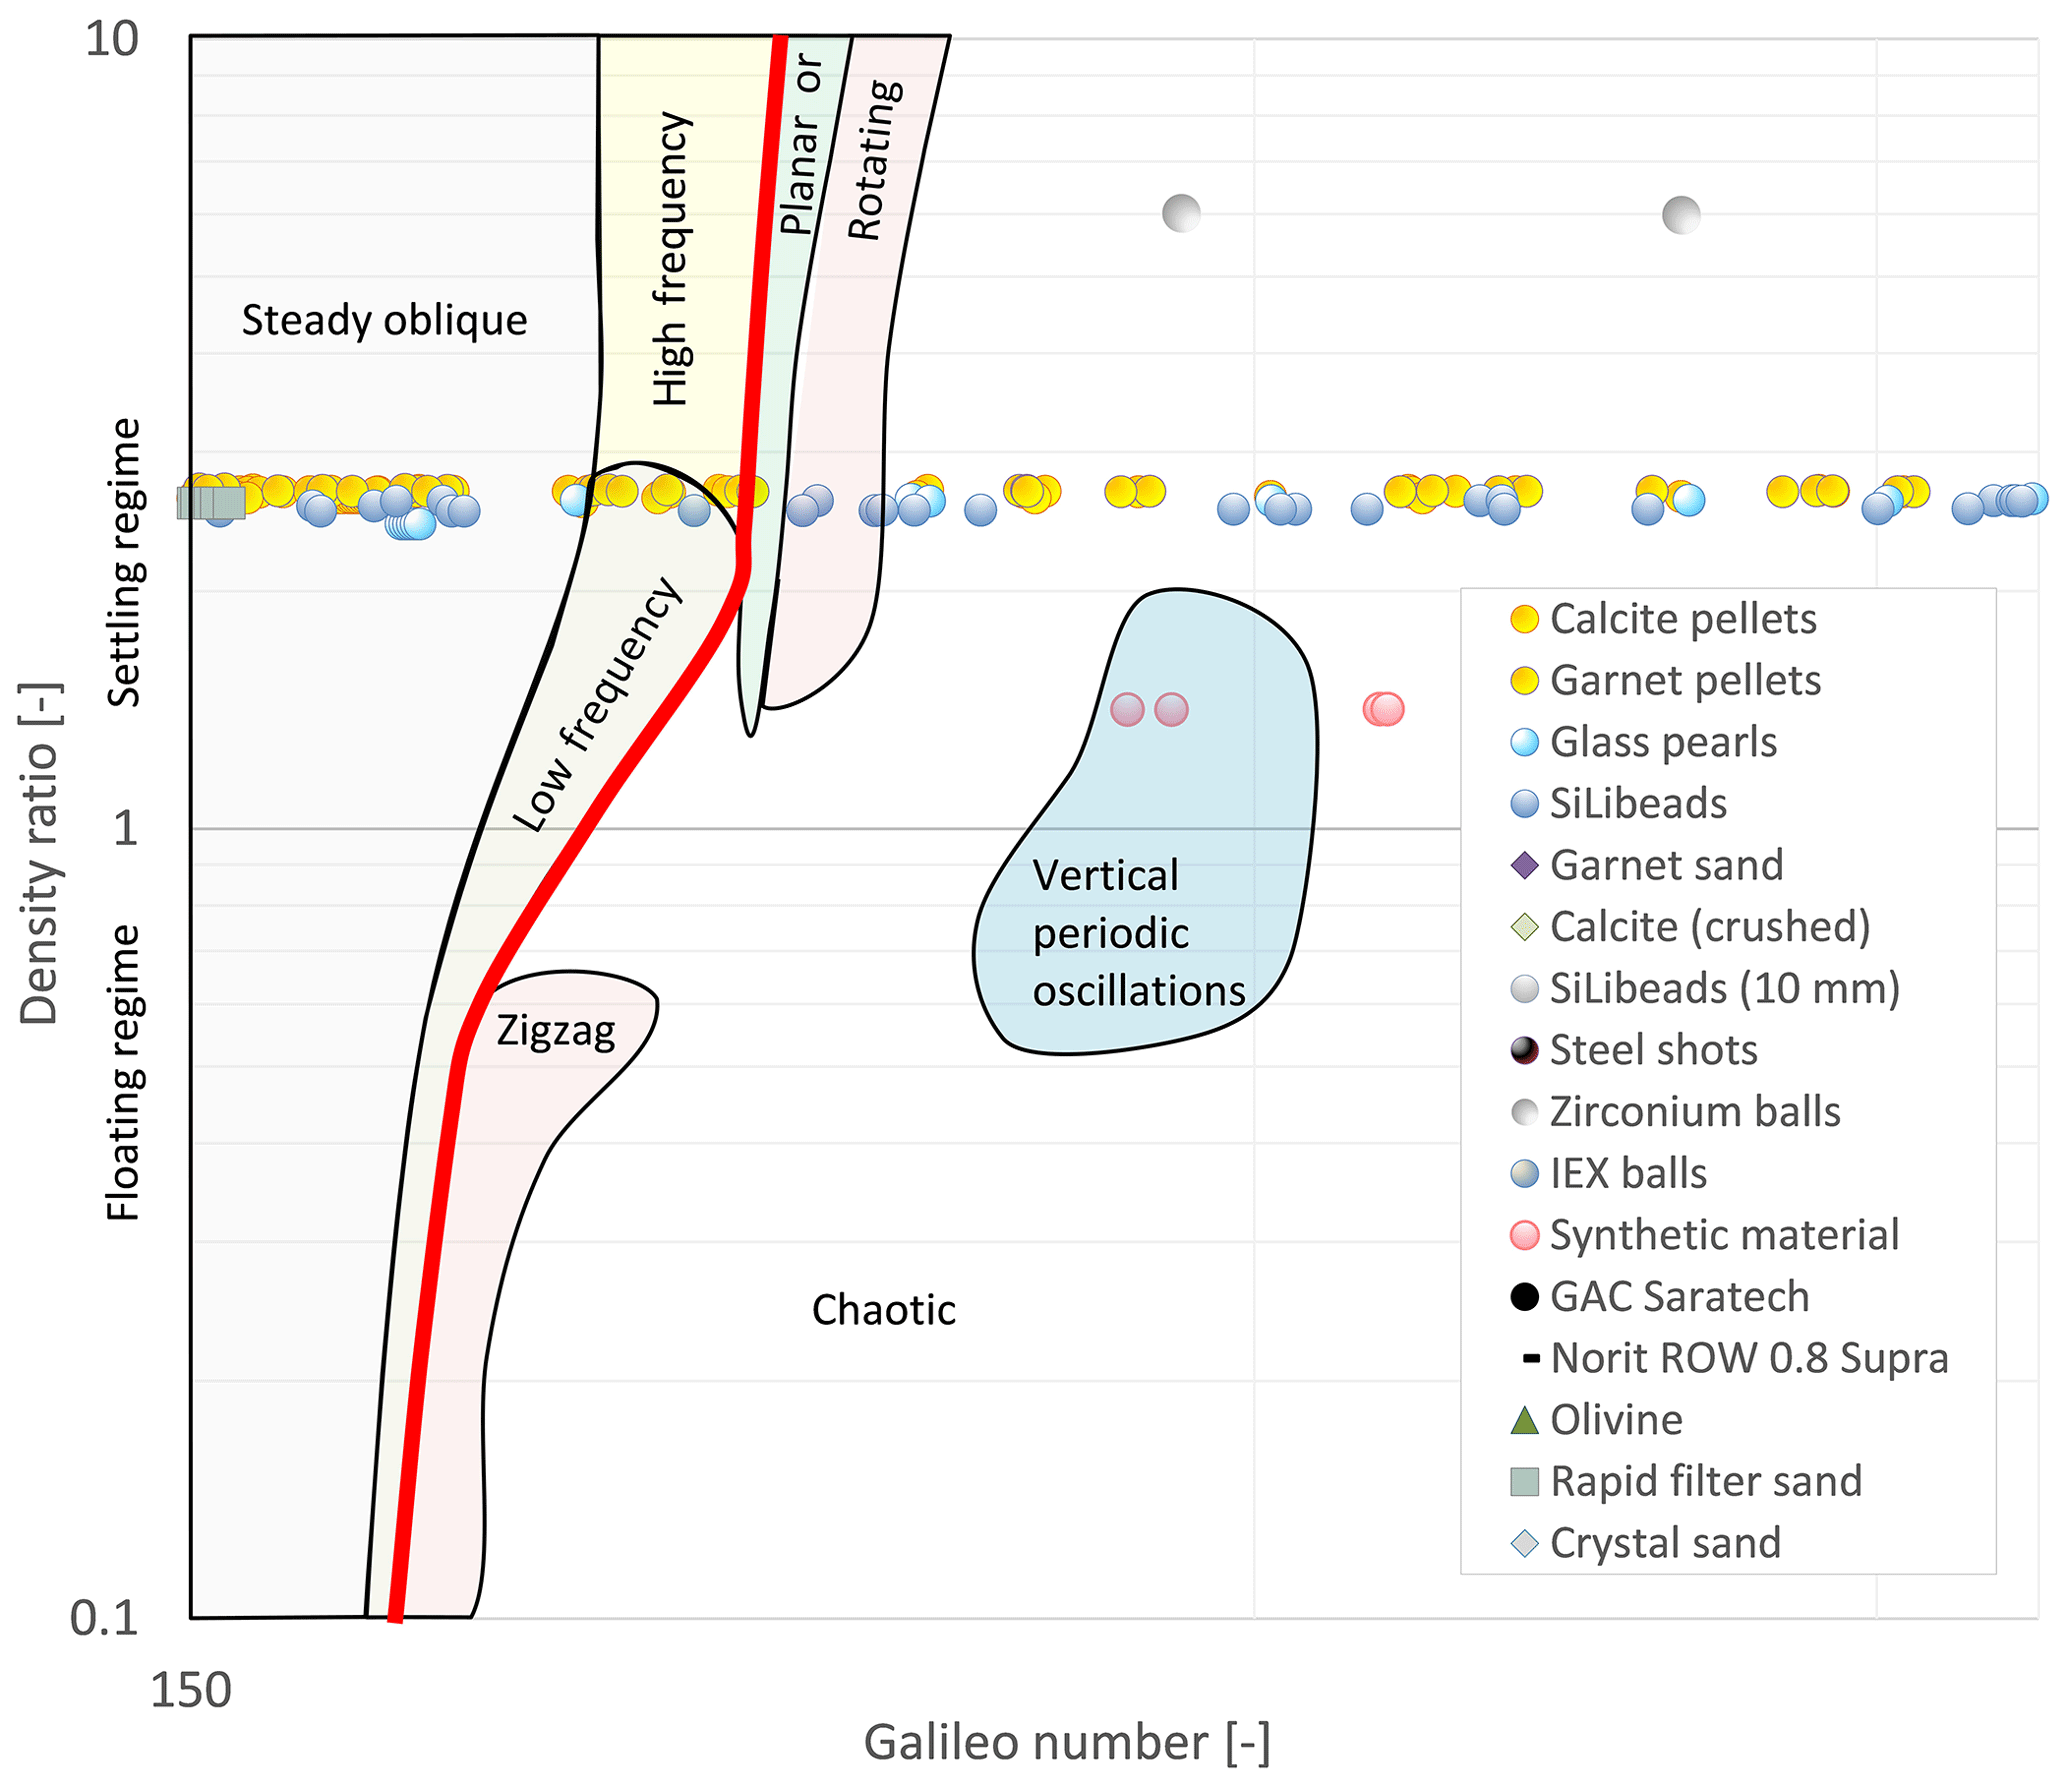
Figure 10Path trajectory regime plot according Zhou and Dušek (2015) and Raaghav (2019; magnified area of Fig. 9). The chaotic regime applies to the right of the red line.
Chaotic paths of freely falling and ascending spheres, path instabilities, and transitions in Newtonian fluid have been discussed by many (Jenny et al., 2004; Veldhuis and Biesheuvel, 2007; Horowitz and Williamson, 2010; Zhou and Dušek, 2015; Auguste and Magnaudet, 2018; Riazi and Türker, 2019) and experimentally proven by Raaghav (2019). To investigate the path trajectories expected for our particles, we investigated the state diagram (Zhou and Dušek, 2015) of the Galileo number Ga versus the density ratio in Fig. 9 and magnified in Fig. 10. The state diagram contains different areas with typical settling behaviours. Several areas overlap, which means that different trajectories might occur. The regime map proposed by Zhou and Dušek is derived for perfect spheres. Path trajectories for calcite pellets will not follow the regime map completely due to their less regular shape, as the regimes are sensitive to the anisotropic nature of the particles. The measured sphericities of calcite pellets, given in the Supplement (Sect. S2), however, have values larger than Φ > 0.9, so we expect a qualitatively similar path trajectory behaviour.
As shown in Fig. 10, about three-quarters of all examined grains belong to the steady oblique regime and one-quarter to the 3D chaotic regime. Calcite pellets show a similar pattern – four-fifths are steady oblique and one-fifth is chaotic. Glass beads show half as being steady oblique and half as being chaotic. Synthetic material and metal balls belong almost completely to the chaotic regime.
The individual path trajectory behaviour of the examined calcite pellets and of other particles is given in the Supplement (Sect. S8). Path trajectory videos are shared by Kramer et al. (2020c).
3.5 Data from the literature
In the literature, raw and processed settling data are available for research purposes. The data set generated by Brown and Lawler (2003) is a composition of previous research experiments on spherical particles (N=480). Other researchers (Wu et al., 2006; Almedeij, 2008; Cheng, 2009; Dioguardi and Mele, 2015; Song et al., 2017; Dioguardi et al., 2018; Breakey et al., 2018) shared data for both spherical and non-spherical particles. Based on the data in the literature, CD versus Ret for N=3655 data points are plotted in Fig. 11. Figure 12 shows a smaller area, focusing on covering the relevant regime for water treatment, where the data spread reconfirms the apparent spread and deviations also found in our work. A data spread of, for instance, ±50 % in CD means a factor of 0.8–1.4 in vt. The consequences for a sand wash installation, for example, is an error in vt of ±20 %, which could raise the question of whether this is sufficiently accurate and suitable for process control. Drag coefficient prediction accuracy, similar to the data in Table 3 and data from the literature, is given in the Supplement (Sects. S5.7 and S17).
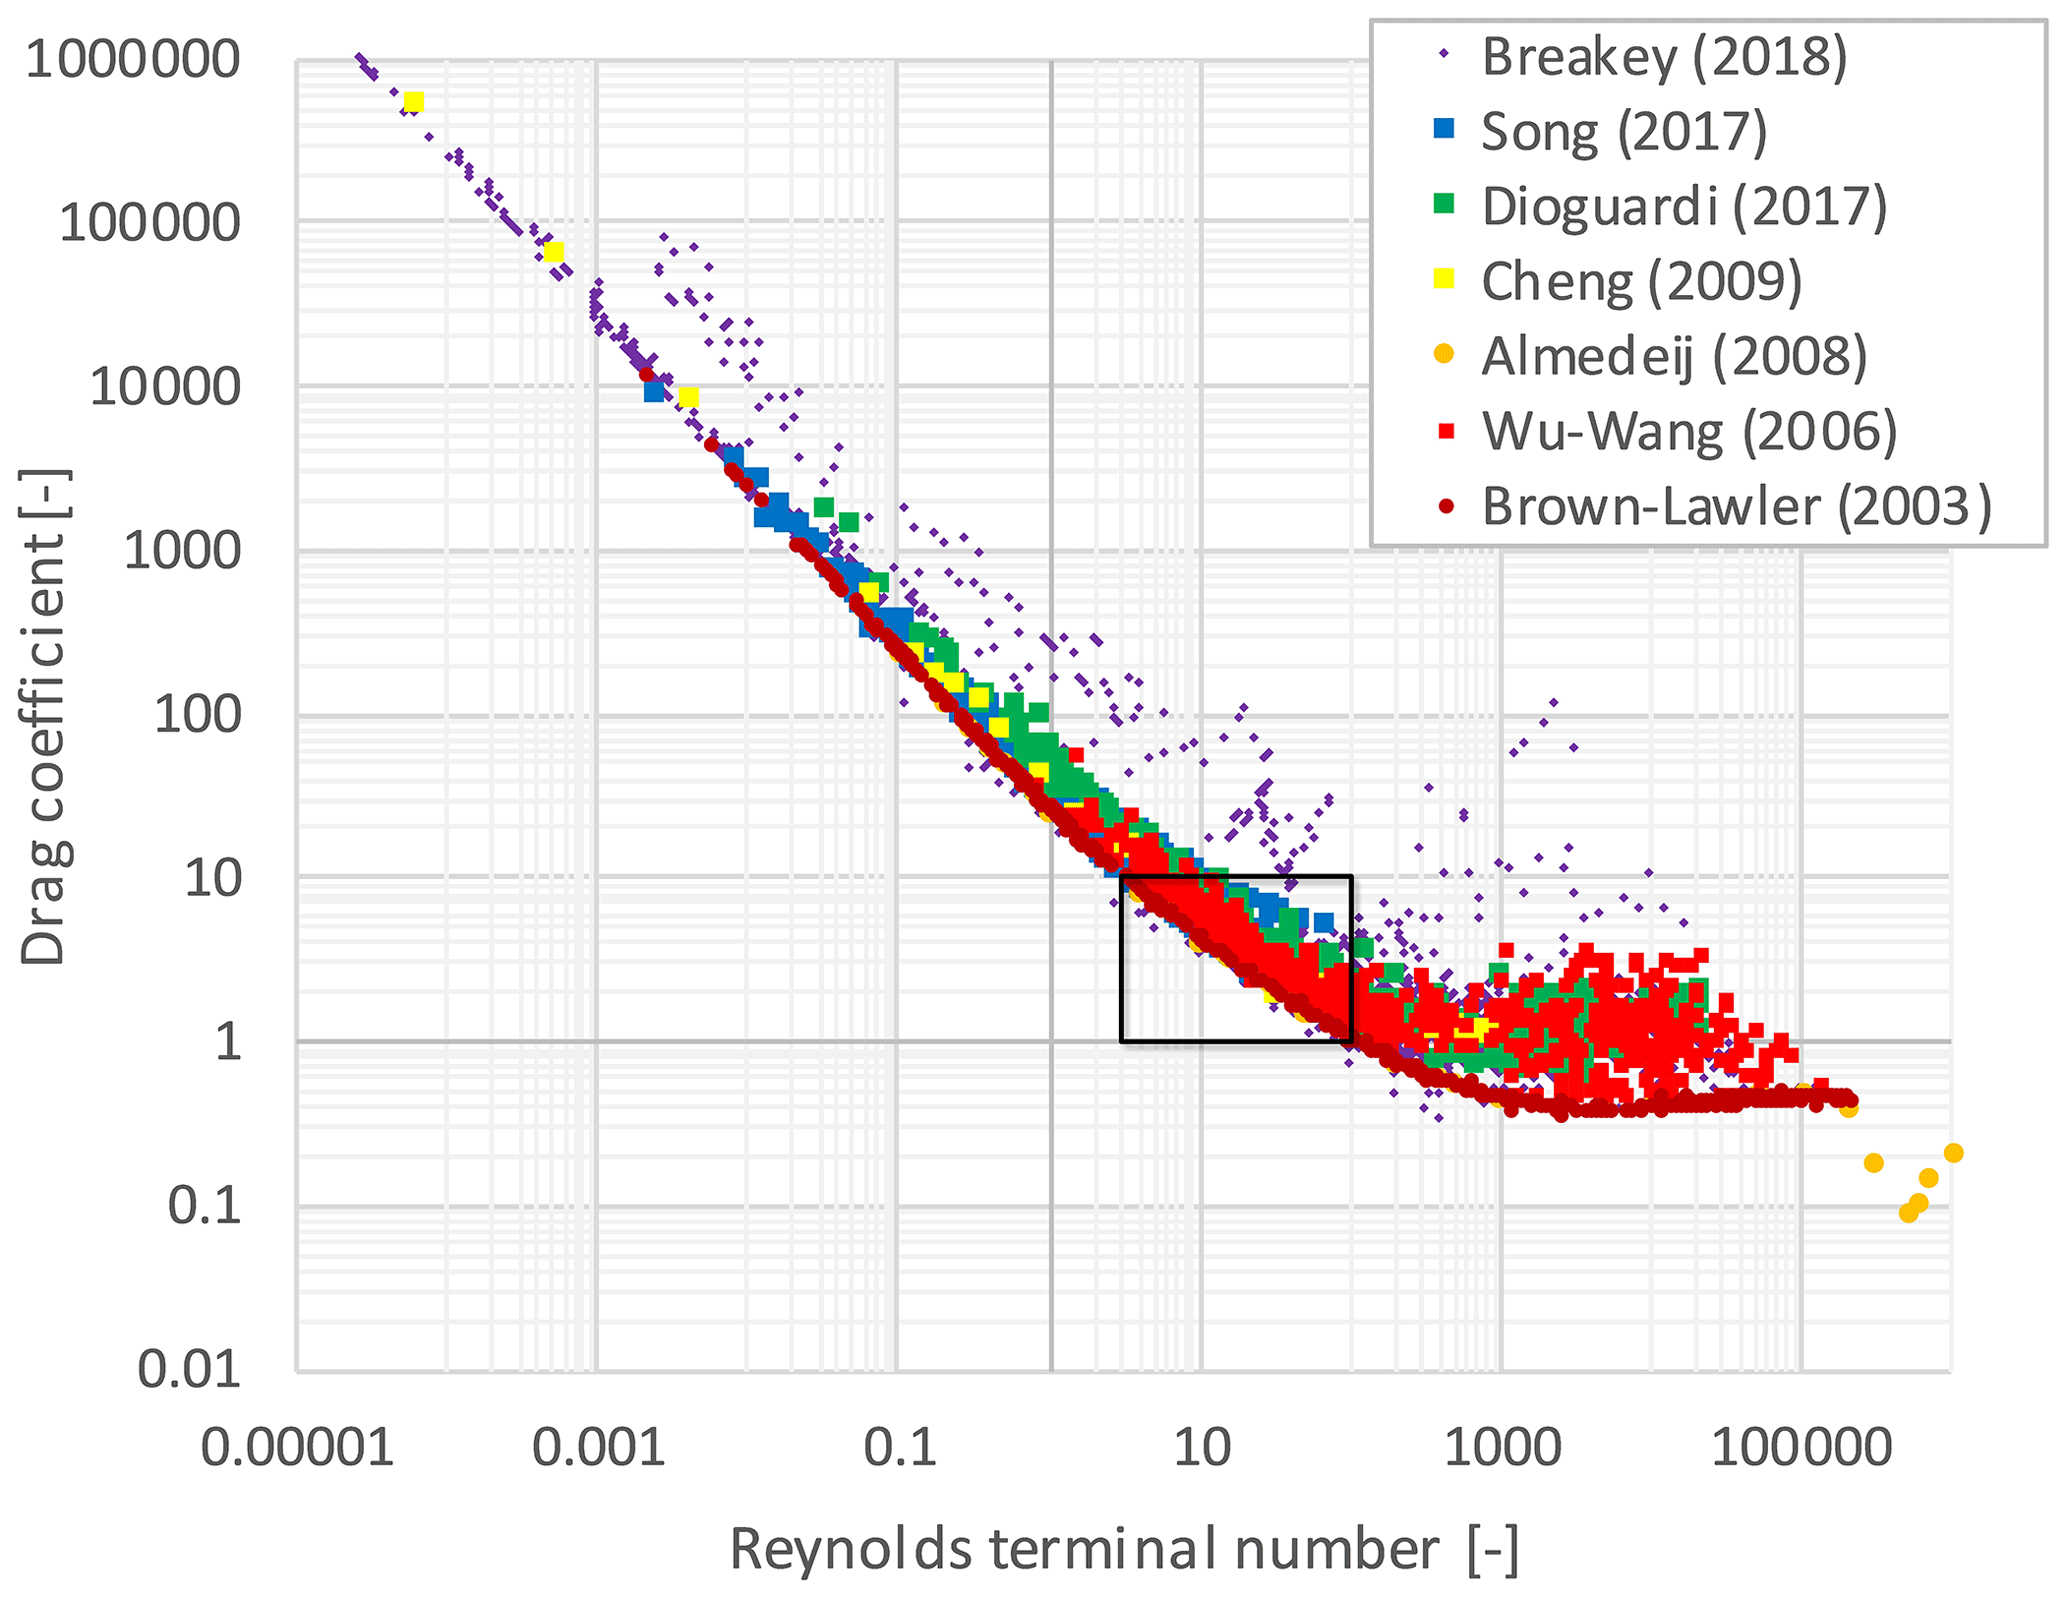
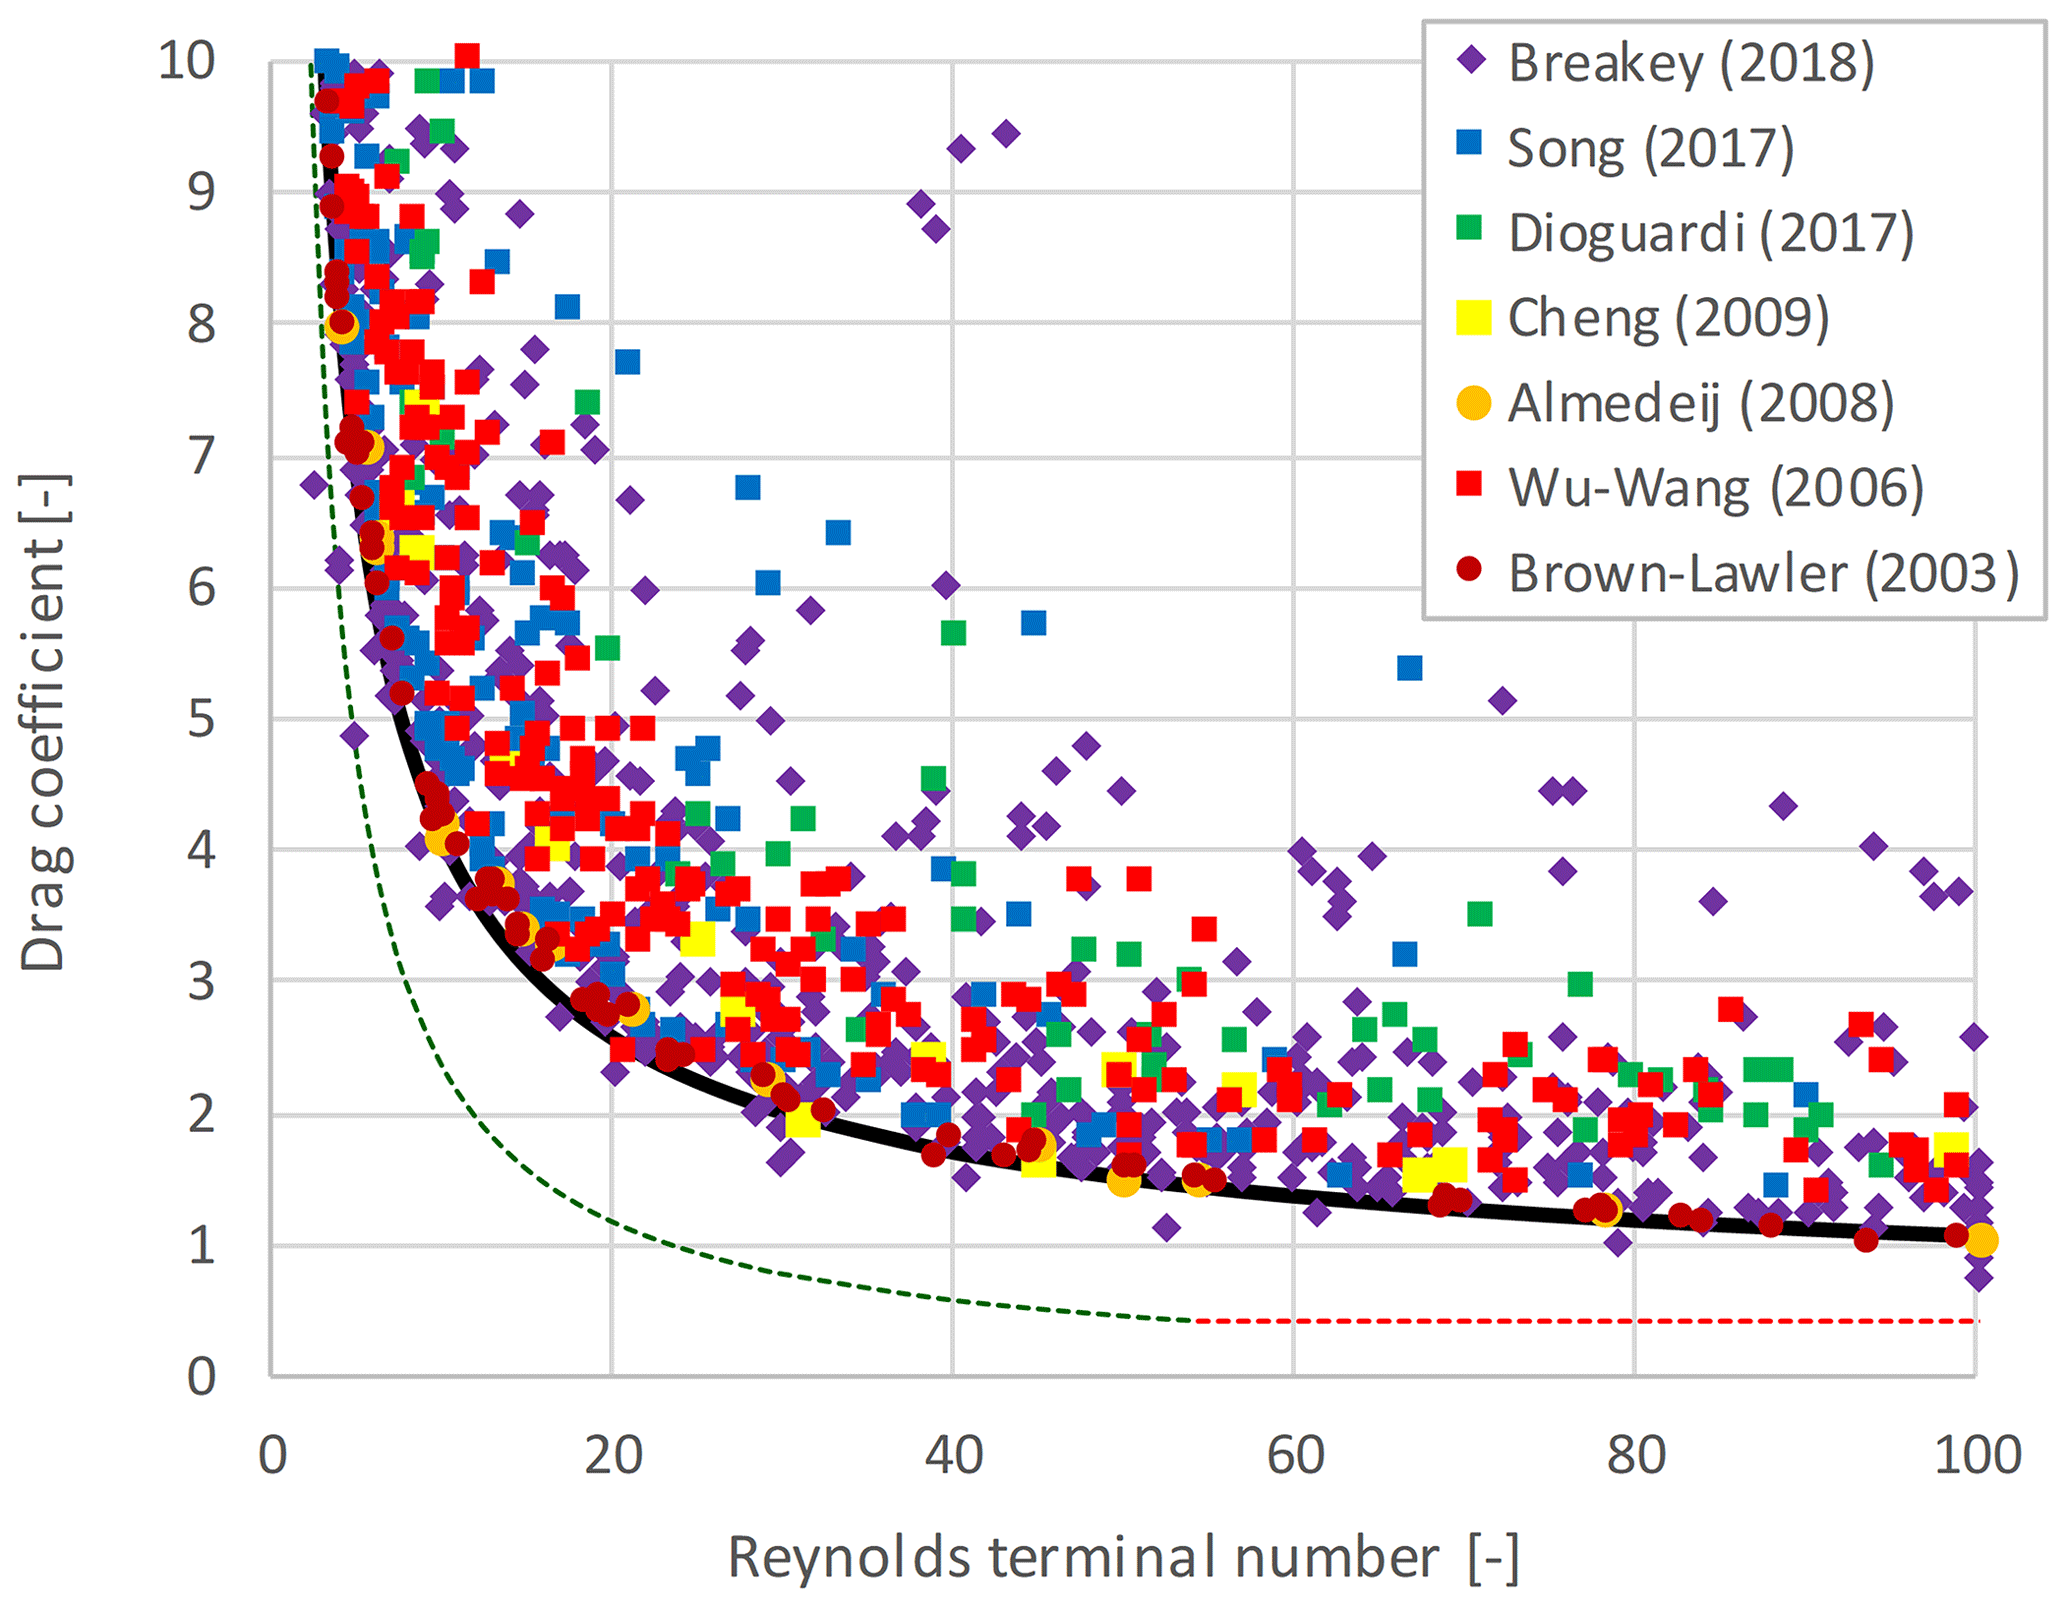
Figure 12SDC (lin–lin) data from the sources in the literature, magnified in on an area that is important for drinking water treatment. Solid lines represent the Brown and Lawler (2003) drag model and dashed lines the Stokes and Newton drag models, respectively.
3.6 Propagated effect of parameter uncertainties on terminal settling
Figure 13 shows the influence of the uncertainty in various parameters on uncertainty in the settling velocity vt. The summarised propagated effect of errors on the uncertainty of the experimental measurements are 35 % for the terminal settling velocity and 56 % for the terminal Reynolds number. The graphically summarised propagated effect of errors for CD and Ret are presented in the Supplement (Sect. S6). The figure shows that some causes, like variation in gravity, surface roughness, and linear expansion due to temperature changes, can be neglected.
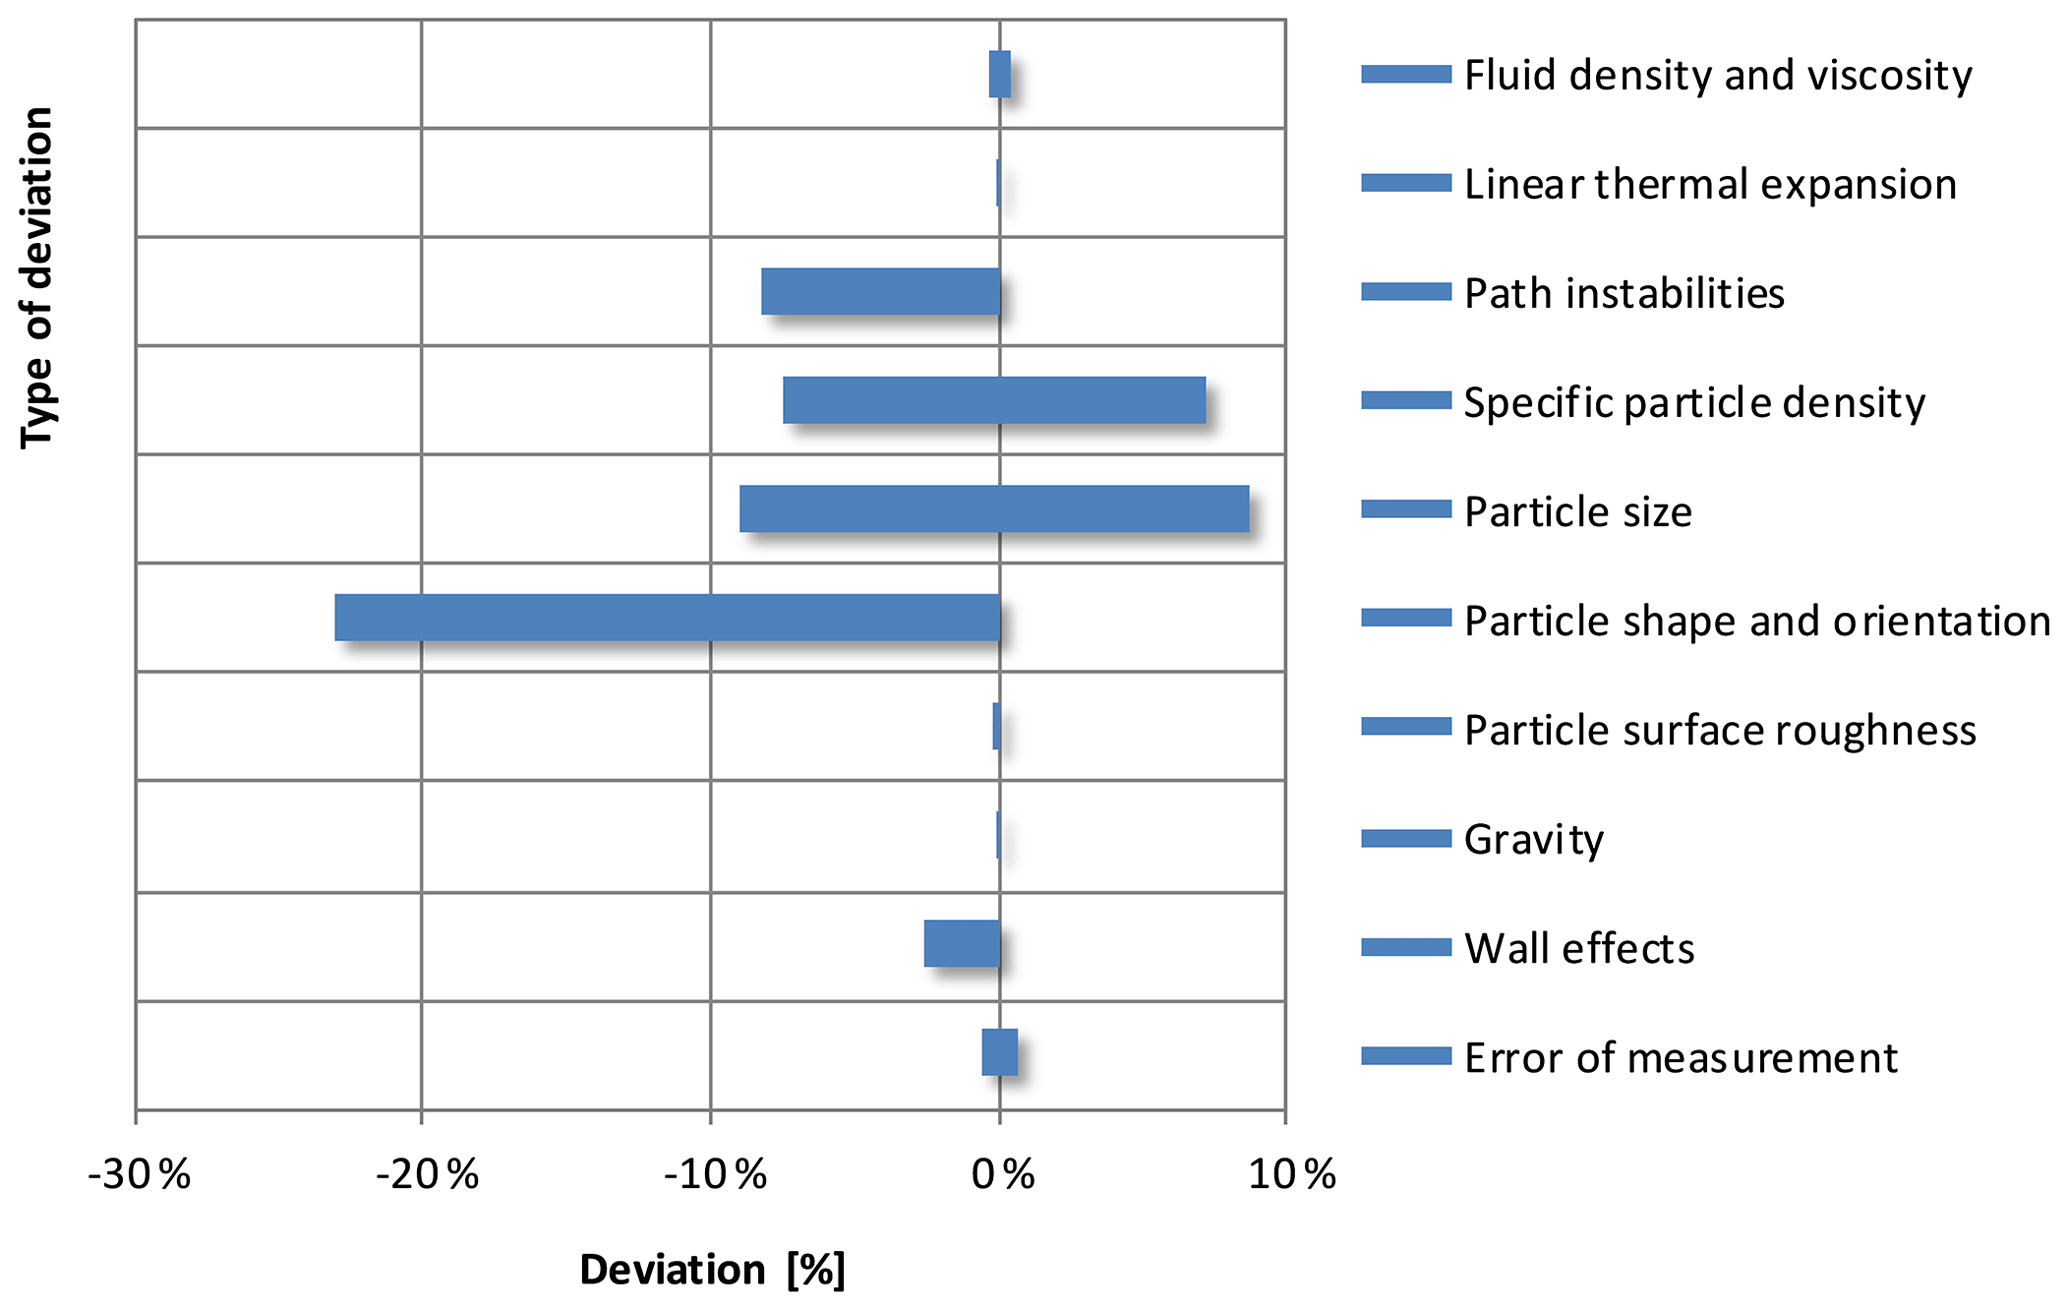
Figure 13Summarised propagated error on the terminal settling velocity resulting from different causes.
Uncertainties in the fluid density and viscosity as well as in the estimated (human) error of measurements have a relatively minor effect on the error in vt. For instance, the error in vt, resulting from the human error in measurements, is estimated at 1.3 %, based on human response time inaccuracies. Depending on the tube and particle dimensions, wall effects, leading to retardation of the settling velocity, can also be ignored – certainly in full-scale systems. Based on the wall effect equation proposed by Arsenijević et al. (2010), which has gained wide acceptance in the literature, the error in vt is estimated to be 2.6 % for all measurements made in this study. Further details and an explanation with respect to wall effects and error analysis can be found in the Supplement (Sect. S13).
Figure 13 shows that the vast majority of the spread is caused by variations in specific particle density, particle size and shape, particle orientation, and path instabilities. The error caused by natural variations in particle density combined with the relative error of experimentally measured particle density in the laboratory was approximately 7 %. The error in vt was calculated at 14.8 %.
Regarding particle size, in this work pellets were sieved to produce more monodisperse particle samples. On the assumption that spheres are round and pass through the sieves, the variation in size (Δdp) is 19.0 %, but this depends on the type of sieve used. The variation in diameter had a considerable effect (17.7 %) on the spread for vt. A special case is included in the Supplement (Sect. S12), based on the assumption that irregularly shaped particles behave like spheroids. It is illustrated how particles pass through a sieve and rotate and settle, and this is compared with a particle on another projected surface.
The literature shows that the effect of particle orientation on the drag coefficient depends on the particle shape (Abraham, 1970; Bird et al., 2007; Loth, 2008; Bagheri and Bonadonna, 2016). As the particle shape becomes less spherical, the effect of the particle orientation becomes more significant due to the increase in the ratio between maximum and minimum projected areas. In the Stokes regime, the particles do not have a preferred orientation, and for a statistically representative run of experiments, they can adopt any random orientation.
An easy preliminary approach for non-spherical shapes can be adopted through the sphericity Φ, which is frequently used in drinking water treatment processes to correct for irregular particles (Yang, 2003). In the case of sand grains, the drag coefficient increases from 1.2 to 1.7 when the sphericity decreases from Φ=1.0 to Φ=0.7, which corresponds to a 20 % increase in CD (US-IACWR, 1957). When the sphericity is decreased stepwise by 10 %, the terminal settling velocity decreases linearly by 10 % while, in contrast, the drag coefficient increases almost twice as much. For sand, Đuriš et al. (2013) selected a reasonable sphericity Φ=0.76. According to Yang (2003), the sphericity varies between Φ=0.66 for sharp sand and 0.86 for round sand, which agrees well with Geldart's observation for measured settling velocity (Geldart, 1990). A sphericity of 0.66 results in a 23.0 % decrease in vt and a 28.6 % increase in CD.
Albright (2009) showed that, for cylindrical particles towards the laminar regime (Ret < 50), the drag coefficient is lower compared to round spheres. However, this coefficient is higher for more turbulent regimes where Ret > 50. Dharmarajah (1982) reported that, under creeping conditions, all orientations are stable ( < 0.1) and that, in the transitional regime (0.1 < < 200), particles are stable since they tend to orient themselves with the largest cross section in the three mutually perpendicular planes of symmetry in a position normal to the direction of motion. Under more turbulent conditions (200 < < 500), the orientation of settling is less predictable; examples include wobbling and rotation. For the inertial regime ( > 500), the particles' rotation about their axis is frequently coupled with spiral translations. Haider and Levenspiel (1989) demonstrated in the drag–Reynolds terminal diagram that, for irregular particles with increasing non-sphericity, the drag coefficients also increase considerably. This can rise by as much as 500 %. This demonstrates that, for higher Reynolds numbers, irregularity becomes increasingly important.
3.7 Consequences of uncertainty in settling velocity for water treatment processes
The discussion on how to measure the terminal settling velocity of a single particle, or multiple particles, is extremely relevant. What is the most representative for a full-scale system? It is not a single particle. Hence, it is important to discuss how single particle measurements can be extrapolated to information relevant for the full-scale system. Often the settling velocity is expressed as a fraction of the terminal settling velocity. For instance, in their famous article, Richardson and Zaki (1954) argued that the settling velocity of multiple particles for a voidage extrapolated to 1 equals the apparent free-falling settling velocity of a single particle at infinite dilution, i.e. the terminal settling velocity vt. Many water treatment processes, like pellet softening and filter backwashing, operate at a voidage in the vicinity of the incipient state (Kramer et al., 2019). Therefore, a large uncertainty in vt has a considerable effect on the voidage prediction, for instance, leading to a fixed bed state where a fluidised bed was expected. In this work, we have explicitly shown the causes of uncertainty in vt.
There is no model for the prediction accuracy of terminal settling velocity and drag coefficient that covers the wide range of differences in particle properties with a low prediction inaccuracy (< 1 %). The prediction accuracy for models derived for non-spherical particles (Haider and Levenspiel, 1989; Ganser, 1993; Hölzer and Sommerfeld, 2008; Ouchene et al., 2016), using the sphericity as a shape descriptor, is not significantly improved for drinking-water-related granules.
Based on measured average terminal settling velocities, drag prediction models like Brown and Lawler (2003) were found to agree reasonably well with experimental observations. However, individual terminal settling velocities showed a considerable amount of spread around the average value. In general, particle size and shape variations as well as chaotic path trajectories during settling are the most decisive reasons why the spread in individual terminal settling velocities occurs. In this work, we observed two kinds of wall effects. Besides their decreased settling velocity, the aspect that is the most frequently discussed in the literature is that particles also show variations in path trajectories where they touch the vessel wall, thus leading to a reduced velocity.
While the majority of the predictive correlations lie within a bandwidth of 6 % between each other, the summarised propagated effect of errors on the uncertainty of the experimental measurements is 34 % for vt, 35 % for CD, and 56 % for Ret. The data obtained from the literature sources also show a considerable degree of spread in CD. The terminal settling velocities determined with an advanced experimental set-up were compared with old school velocities measured by eye and stopwatch. The average relative error between the two methods was only 4 % ± 3 %, so this cannot explain the observed large spread in individual measurements. Simple models, such as (Goossens, 2019), have a relatively low prediction accuracy, based on the data acquired. Nevertheless, one should take the existing data spread around the average CD into consideration when other models are used with apparently higher prediction accuracies. In other words, more complex expressions do not automatically entail higher accuracy.
Our results have important implications for when drinking water treatment processes are optimised or designed, for instance, with a new type of grain with specific morphological, density, or other particle properties. It is important to take note of the spread in settling velocities. The considerable degree of spread in terminal settling velocities could result in less optimal process states and lower efficiency in the use of raw materials and should, therefore, be taken into account in the design, operation, and optimisation of water treatment processes.
Finally, the prediction accuracy for terminal settling velocity and drag coefficient should be improved, in particular for non-spherical particles.
In conclusion, to answer our main question of whether terminal settling velocity and drag of natural particles in water can ever be predicted accurately, we have to affirm that it is possible – at least for spherical particles and using a model such as Brown and Lawler (2003). The answer is a possible yes for non-spherical particles, albeit only when more morphological properties are included besides (equivalent) particle diameter, circularity, and sphericity. During the past decades, novel work has been published on the topic of terminal settling. Nevertheless, some puzzles remain unsolved. The prediction accuracy can be improved by means of new, advanced research still to be carried out in academia and in industry.
Subscripts, superscripts, and abbreviations can be found in the Supplement (Sect. S15).
The underlying data can be found in the Supplement.
The audiovisual material associated with this research can be found at https://doi.org/10.4121/uuid:3ffdfa51-38f0-4188-aec5-8cd8fc8f1941 (Kramer et al., 2020c).
The supplement related to this article is available online at: https://doi.org/10.5194/dwes-14-53-2021-supplement.
OJIK and PJdM conceptualised the study and developed the methodology. OJIK curated the data, generated the visualisations, led the investigation, and wrote the original draft. ETB and OJIK organised the bulk terminal settling experiments. SKRR and WPB facilitated the advanced terminal settling experiments. WHvV provided statistical analysis of all the data. All co-authors reviewed and edited the paper. JPvdH and JTP supervised the research.
The authors declare that they have no conflict of interest.
This research is part of the project “Hydraulic modelling of liquid–solid fluidisation in drinking water treatment processes” carried out by Waternet (the water utility of Amsterdam and surroundings), Delft University of Technology, and HU University of Applied Sciences Utrecht. Financial support came from Waternet's Drinking Water Production Department. For our simulation, we used the symbolic regression software of Eureqa, and we thank Nutonian for allowing us to use their software.
We acknowledge and thank our students from Delft University of Technology, HU University of Applied Sciences Utrecht, and Queen Mary University of London, and in particular Victor Shao and Cas van Schaik for the precise execution of many laboratory and pilot plant experiments. Finally, we also thank Desmond Lawler, professor at the University of Texas, and Reza Barati, of the Tarbiat Modares University, for sharing the original drag and terminal settling data.
This research project did not receive any specific grant from funding agencies in the public, commercial, or non-profit sectors.
This paper was edited by Luuk Rietveld and reviewed by two anonymous referees.
Abraham, F. F.: Functional dependence of drag coefficient of a sphere on Reynolds number, Phys. Fluids, 13, 2194–2195, https://doi.org/10.1063/1.1693218, 1970.
Albright, J.: Albright's chemical engineering handbook, CRC Press, New York, USA, 2009.
Almedeij, J.: Drag coefficient of flow around a sphere: Matching asymptotically the wide trend, Powder Technol., 186, 218–223, https://doi.org/10.1016/j.powtec.2007.12.006, 2008.
Amburgey, J. E.: Optimization of the extended terminal subfluidization wash (ETSW) filter backwashing procedure, Water Res., 39, 314–330, https://doi.org/10.1016/j.watres.2004.09.020, 2005.
Arsenijević, Z. L., Grbavčić, Ž. B., Garić-Grulović, R. V., and Bošković-Vragolović, N. M.: Wall effects on the velocities of a single sphere settling in a stagnant and counter-current fluid and rising in a co-current fluid, Powder Technol., 203, 237–242, https://doi.org/10.1016/j.powtec.2010.05.013, 2010.
Auguste, F. and Magnaudet, J.: Path oscillations and enhanced drag of light rising spheres, J. Fluid Mech., 841, 228–266, https://doi.org/10.1017/jfm.2018.100, 2018.
Bagheri, G. and Bonadonna, C.: On the drag of freely falling non-spherical particles, Powder Technol., 301, 526–544, https://doi.org/10.1016/j.powtec.2016.06.015, 2016.
Baldock, T. E., Tomkins, M. R., Nielsen, P., and Hughes, M. G.: Settling velocity of sediments at high concentrations, Coast. Eng., 51, 91–100, https://doi.org/10.1016/j.coastaleng.2003.12.004, 2004.
Barati, R. and Neyshabouri, S. A. A. S.: Comment on “Summary of frictional drag coefficient relationships for spheres: Evolving solution strategies applied to an old problem”, Chem. Eng. Sci., 168, 339–343, https://doi.org/10.1016/j.ces.2017.04.037, 2018.
Barati, R., Neyshabouri, S. A. A. S., and Ahmadi, G.: Development of empirical models with high accuracy for estimation of drag coefficient of flow around a smooth sphere: an evolutionary approach, Powder Technol., 257, 11–19, https://doi.org/10.1016/j.powtec.2014.02.045, 2014.
Beeftink, M., Hofs, B., Kramer, O. J. I., Odegard, I., and van der Wal, A.: Carbon footprint of drinking water softening as determined by life cycle assessment, J. Clean. Prod., 278, 123925, https://doi.org/10.1016/j.jclepro.2020.123925, 2021.
Bird, R. B., Stewart, W. E., and Lightfoot, E. N.: Transport phenomena, Wiley, New York, USA, 2007.
Breakey, D. E. S., Vaezi, G. F., Masliyah, J. H., and Sanders, R. S.: Side-view-only determination of drag coefficient and settling velocity for non-spherical particles, Powder Technol., 339, 182–191, https://doi.org/10.1016/j.powtec.2018.07.056, 2018.
Brown, P. P. and Lawler, D. F.: Sphere drag and settling velocity revisited, J. Environmen. Eng., 129, 222–231, https://doi.org/10.1061/(ASCE)0733-9372(2003)129:3(222), 2003.
Camp, T. R.: Sedimentation and the design of settling tanks, T. Am. Soc. Civ. Eng., 111, 895–936, 1946.
Cheng, N. S.: Comparison of formulas for drag coefficient and settling velocity of spherical particles, Powder Technol., 189, 395–398, https://doi.org/10.1016/j.powtec.2008.07.006, 2009.
Cheng, N.-S.: Simplified settling velocity formula for sediment particle, J. Hydraul. Eng., 123, 149–152, https://doi.org/10.1061/(ASCE)0733-9429(1997)123:2(149), 1997.
Cheremisinoff, N. P.: Handbook of water and wastewater treatment technologies, Butterworth-Heinemann, Boston, USA, 2002.
Chhabra, R. P., Agarwal, S., and Chaudhary, K.: A note on wall effect on the terminal falling velocity of a sphere in quiescent Newtonian media in cylindrical tubes, Powder Technol., 129, 53–58, https://doi.org/10.1016/S0032-5910(02)00164-X, 2003.
Chien, S. F.: Settling velocity of irregularly shaped particles, SPE Drill. Completion, 9, 281–289, https://doi.org/10.1016/0148-9062(95)92494-3, 1994.
Cleasby, J. L., Arboleda, J., Burns, D. E., Prendiville, P. W., and Savage, E. S.: Backwashing of granular filters, J. Am. Water Works Ass., 69, 115–126, 1977.
Clift, R. and Gauvin, W. H.: Motion of entrained particles in gas streams, Can. J. Chem. Eng., 49, 439–448, https://doi.org/10.1002/cjce.5450490403, 1971.
Clift, R., Grace, J. R., and Weber, M. E.: Bubbles, drops, and particles, Academic Press, San Diego, CA, USA, 1978.
Concha, F. and Almendra, E. R.: Settling velocities of particulate systems, 1. settling velocities of individual spherical particles, Int. J. Miner. Process., 5, 349–367, https://doi.org/10.1016/0301-7516(79)90044-9, 1979.
Crittenden, J. C., Trussell, R. R., Hand, D. W., Howe, K. J., and Tchobanoglous, G.: MWH's water treatment: principles and design, Wiley, New York, USA, 2012.
Dabrowski, W., Spaczyńska, M., and Mackie, R. I.: A model to predict granular activated carbon backwash curves, Clean-Soil Air Water, 36, 103–110, https://doi.org/10.1002/clen.200600033, 2008.
Dallavalle, J. M.: Micromeritics – the technology of fine particles, 2nd ed., Pitman Publishing Ltd, London, UK, 1948.
Dharmarajah, A. H.: Effect of particle shape on prediction of velocity-voidage relationship in fluidized solid-liquid systems, Retrospective Theses and Dissertations, Iowa State University, Ames, USA, 7535, 1982.
Di Felice, R. and Gibilaro, L. G.: Wall effects for the pressure drop in fixed beds, Chem. Eng. Sci., 59, 3037–3040, https://doi.org/10.1016/j.ces.2004.03.030, 2004.
Dioguardi, F. and Mele, D.: A new shape dependent drag correlation formula for non-spherical rough particles. Experiments and results, Powder Technol., 277, 222–230, https://doi.org/10.1016/j.powtec.2015.02.062, 2015.
Dioguardi, F., Mele, D., and Dellino, P.: A new one-equation model of fluid drag for irregularly shaped particles valid over a wide range of Reynolds number, J. Geophys. Res.-Sol. Ea., 123, 144–156, https://doi.org/10.1002/2017JB014926, 2018.
Đuriš, M., Garić-Grulović, R., Arsenijević, Z., Jaćimovski, D., and Grbavčić, Ž.: Segregation in water fluidized beds of sand particles, Powder Technol., 235, 173–179, https://doi.org/10.1016/j.powtec.2012.10.004, 2013.
Edzwald, J. K.: Water quality and treatment: a handbook on drinking water, American Water Works Association and American Society of Civil Engineers, McGraw-Hill, NY, USA, 2011.
Fair, G. M., Geyer, J. C., and Okun, D. A.: Elements of water supply and waste water disposal, 1st edn., John Wiley & Sons, New York, USA, 1954.
Filho, W. L. and Sümer, V.: Sustainable water use and management examples of new approaches and perspectives, Springer, Cham, Switzerland, 2015.
Flemmer, R. L. C. and Banks, C. L.: On the drag coefficient of a sphere, Powder Technol., 48, 217–221, https://doi.org/10.1016/0032-5910(86)80044-4, 1986.
Ganser, G. H.: A rational approach to drag prediction of spherical and nonspherical particles, Powder Technol., 77, 143–152, https://doi.org/10.1016/0032-5910(93)80051-B, 1993.
Geldart, D.: Estimation of basic particle properties for use in fluid-particle process calculations, Powder Technol., 60, 1–13, https://doi.org/10.1016/0032-5910(90)80099-K, 1990.
Gibilaro, L. G., Di Felice, R., Waldram, S. P., and Foscolo, P. U.: Generalized friction factor and drag coefficient correlations for fluid particle interactions, Chem. Eng. Sci., 40, 1817–1823, 1985.
Goossens, W. R. A.: Review of the empirical correlations for the drag coefficient of rigid spheres, Powder Technol., 352, 350–359, https://doi.org/10.1016/j.powtec.2019.04.075, 2019.
Graveland, A., van Dijk, J. C., de Moel, P. J., and Oomen, J. H. C. M.: Developments in water softening by means of pellet reactors, J. Am. Water Works Ass., 75, 619–625, 1983.
Haider, A. and Levenspiel, O.: Drag coefficients and terminal velocity of spherical and nonspherical particles, Powder Technol., 58, 63–70, 1989.
Hölzer, A. and Sommerfeld, M.: New simple correlation formula for the drag coefficient of non-spherical particles, Powder Technol., 184, 361–365, https://doi.org/10.1016/j.powtec.2007.08.021, 2008.
Horowitz, M. and Williamson, C. H. K.: The effect of Reynolds number on the dynamics and wakes of freely rising and falling spheres, J. Fluid Mech., 651, 251–294, https://doi.org/10.1017/S0022112009993934, 2010.
Howe, K. J., Hand, D. W., Crittenden, J. C., Rhodes Trussell, R., and Tchobanoglous, G.: Principles of water treatment, Wiley, New Jersey, USA, 2012.
Hunce, S. Y., Soyer, E., and Akgiray, Ö.: On the backwash expansion of graded filter media, Powder Technol., 333, 262–268, https://doi.org/10.1016/j.powtec.2018.04.032, 2018.
Jenny, M., Dušek, J., and Bouchet, G.: Instabilities and transition of a sphere falling or ascending freely in a Newtonian fluid, J. Fluid Mech., 508, 201–239, https://doi.org/10.1017/S0022112004009164, 2004.
Karamanev, D. G.: Equations for calculation of the terminal velocity and drag coefficient of solid spheres and gas bubbles, Chem. Eng. Commun., 147, 75–84, https://doi.org/10.1080/00986449608936496, 1996.
Khan, A. R. and Richardson, J. F.: The resistance to motion of a solid sphere in a fluid, Chem. Eng. Commun., 62, 135–150, https://doi.org/10.1080/00986448708912056, 1987.
Kramer, O. J. I., de Moel, P. J., Baars, E. T., van Vugt, W. H., Padding, J. T., and van der Hoek, J. P.: Improvement of the Richardson-Zaki liquid-solid fluidisation model on the basis of hydraulics, Powder Technol., 343, 465–478, https://doi.org/10.1016/j.powtec.2018.11.018, 2019.
Kramer, O. J. I., de Moel, P. J., Padding, J. T., Baars, E. T., el Hasadi, Y. M. F., Boek, E. S., and van der Hoek, J. P.: Accurate voidage prediction in fluidisation systems for full-scale drinking water pellet softening reactors using data driven models, J. Water Process Eng., 37, 101481, https://doi.org/10.1016/j.jwpe.2020.101481, 2020a.
Kramer, O. J. I., Padding, J. T., van Vugt, W. H., de Moel, P. J., Baars, E. T., Boek, E. S., and van der Hoek, J. P.: Improvement of voidage prediction in liquid-solid fluidized beds by inclusion of the Froude number in effective drag relations, Int. J. Multiphas. Flow, 127, 101481, https://doi.org/10.1016/j.ijmultiphaseflow.2020.103261, 2020b.
Kramer, O. J. I., Raaghav, S. K. R., and Breugem, W. P.: Videos of terminal settling experiments in water: path instabilities, 4TU.Centre for Research Data, https://doi.org/10.4121/uuid:3ffdfa51-38f0-4188-aec5-8cd8fc8f1941, 2020c.
Ku, H. H.: Notes on the use of propagation of error formulas, J. Res. Nat. Bur. Stand., 70, 263, https://doi.org/10.6028/jres.070C.025, 1966.
Lapple, C. E. and Shepherd, C. B.: Calculation of particle trajectories, Ind. Eng. Chem., 32, 605–617, https://doi.org/10.1021/ie50365a007, 1940.
Loeffler, A. L.: Mechanism of hindered settling and fluidization, Retrospective Theses and Dissertations, Iowa State University, Ames, USA, 13317, 1953.
Loth, E.: Drag of non-spherical solid particles of regular and irregular shape, Powder Technol., 182, 342–353, https://doi.org/10.1016/j.powtec.2007.06.001, 2008.
Marques, R. C., da Cruz, N. F., and Pires, J.: Measuring the sustainability of urban water services, Environ. Sci. Policy, 54, 142–151, https://doi.org/10.1016/j.envsci.2015.07.003, 2015.
Morrison, F. A.: An introduction to fluid mechanics, Cambridge University Press, New York, USA, 2013.
Munson, B. R., Rothmayer, A. P., Okiishi, T. H., and Huebsch, W. W.: Fundamentals of fluid mechanics, Wiley, New York, USA, 2020.
Ouchene, R., Khalij, M., Arcen, B., and Tanière, A.: A new set of correlations of drag, lift and torque coefficients for non-spherical particles and large Reynolds numbers, Powder Technol., 303, 33–43, https://doi.org/10.1016/j.powtec.2016.07.067, 2016.
Raaghav, S. K. R.: Path instabilities of a rising or falling sphere in a fluid at rest – an experimental study, Delft, available at: http://resolver.tudelft.nl/uuid:cbaf6de1-dcf9-41ab-a5bc-3a4d364bfd45 (last access: 1 February 2021), 2019.
Ray, C. and Jain, R.: Drinking water treatment focusing on appropriate technology and sustainability introduction, Springer, Dordrecht, the Netherlands, 2011.
Riazi, A. and Türker, U.: The drag coefficient and settling velocity of natural sediment particles, Computational Particle Mechanics, 6, 427–437, https://doi.org/10.1007/s40571-019-00223-6, 2019.
Richardson, J. F. and Zaki, W. N.: Sedimentation and fluidisation: part I, T. I. Chem. Eng.-Lond., 32, 35–53, https://doi.org/10.1016/S0263-8762(97)80006-8, 1954.
Rietveld, L. C.: Improving operation of drinking water treatment through modelling, available at: http://resolver.tudelft.nl/uuid:4f4e110a-a1ea-4d51-b645-3c9c58c67c92 (last access: 1 February 2021), 2005.
Schetters, M. J. A., van der Hoek, J. P., Kramer, O. J. I., Kors, L. J., Palmen, L. J., Hofs, B., and Koppers, H.: Circular economy in drinking water treatment: re-use of ground pellets as seeding material in the pellet softening process, Water Sci. Technol., 71, 479–486, https://doi.org/10.2166/wst.2014.494, 2015.
Schiller, L. and Naumann, A.: Über die grundlegenden berechnungen bei der schwerkraftaufbereitung, Z. Ver. Dtsch. Ing., 29, 318–320, 1933.
Song, X., Xu, Z., Li, G., Pang, Z., and Zhu, Z.: A new model for predicting drag coefficient and settling velocity of spherical and non-spherical particle in Newtonian fluid, Powder Technol., 321, 242–250, https://doi.org/10.1016/j.powtec.2017.08.017, 2017.
Soyer, E. and Akgiray, O.: A new simple equation for the prediction of filter expansion during backwashing, J. Water Supply Res. T., 58, 336–345, https://doi.org/10.2166/aqua.2009.090, 2009.
Terfous, A., Hazzab, A., and Ghenaim, A.: Predicting the drag coefficient and settling velocity of spherical particles, Powder Technol., 239, 12–20, https://doi.org/10.1016/j.powtec.2013.01.052, 2013.
Tomkins, M. R., Baldock, T. E., and Nielsen, P.: Hindered settling of sand grains, Sedimentology, 52, 1425–1432, https://doi.org/10.1111/j.1365-3091.2005.00750.x, 2005.
Turton, R. and Levenspiel, O.: A short note on the drag correlation for spheres, Powder Technol., 47, 83–86, https://doi.org/10.1016/0032-5910(86)80012-2, 1986.
US-IACWR: A study of methods used in measurement and analysis of sediment loads in streams. Some fundamentals of particle size analysis, Report no. 12, United States Inter-Agency Committee on Water Resources, Prepared for Publication by Project Offices of Cooperating Agencies at St. Anthony Falls Hydraulic Laboratory, Minneapolis, Minnesota, USA, 1957.
van Schagen, K. M.: Model-based control of drinking-water treatment plants, Delft, available at: http://repository.tudelft.nl/view/ir/uuid:fc4d865d-1ed7-409e-83ba-6270dacdec67/ (last access: 29 January 2021), 2009.
van Schagen, K. M., Rietveld, L. C., Babuška, R., and Kramer, O. J. I.: Model-based operational constraints for fluidised bed crystallisation, Water Res., 42, 327–337, https://doi.org/10.1016/j.watres.2007.07.019, 2008.
Veldhuis, C. H. J. and Biesheuvel, A.: An experimental study of the regimes of motion of spheres falling or ascending freely in a Newtonian fluid, Int. J. Multiphas. Flow, 33, 1074–1087, https://doi.org/10.1016/j.ijmultiphaseflow.2007.05.002, 2007.
Veldhuis, C. H. J., Biesheuvel, A., and Lohse, D.: Freely rising light solid spheres, Int. J. Multiphas. Flow, 35, 312–322, https://doi.org/10.1016/j.ijmultiphaseflow.2009.01.005, 2009.
Whiten, W. J. and Özer, C. E.: New relation for the computation of settling velocities and diameters of spheres, Min. Proc. Ext. Met. Rev., 36, 92–102, https://doi.org/10.1080/08827508.2014.885904, 2015.
Wu, W., Asce, M., Wang, S. S. Y., and Asce, F.: Formulas for sediment porosity and settling velocity, J. Hydraul. Eng., 132, 858–862, https://doi.org/10.1061/(ASCE)0733-9429(2006)132:8(858), 2006.
Yang, H., Fan, M., Liu, A., and Dong, L.: General formulas for drag coefficient and settling velocity of sphere based on theoretical law, International Journal of Mining Science and Technology, 25, 219–223, https://doi.org/10.1016/j.ijmst.2015.02.009, 2015.
Yang, W. C.: Handbook of fluidization and fluid-particle systems, CRC Press, New York, USA, 2003.
Zhiyao, S., Tingting, W., Fumin, X., and Ruijie, L.: A simple formula for predicting settling velocity of sediment particles, Water Sci. Engi., 1, 37–43, https://doi.org/10.1016/s1674-2370(15)30017-x, 2008.
Zhou, W. and Dušek, J.: Chaotic states and order in the chaos of the paths of freely falling and ascending spheres, Int. J. Multiphas. Flow, 75, 205–223, https://doi.org/10.1016/j.ijmultiphaseflow.2015.05.010, 2015.