the Creative Commons Attribution 4.0 License.
the Creative Commons Attribution 4.0 License.
Analysis of water distribution network under pressure-deficient conditions through emitter setting
Suribabu Conety Ravi
Neelakantan Thurvas Renganathan
Sivakumar Perumal
Diego Paez
Pressure-driven analysis (PDA) of water distribution networks necessitates an assessment of the supplying capacity of a network within the minimum and required pressure ranges. Pressure-deficient conditions happen due to the uncertainty of nodal demands, failure of electromechanical components, diversion of water, aging of pipes, permanent increase in the demand at certain supply nodes, fire demand, etc. As the demand-driven analysis (DDA) solves the governing equations without any bound on pressure head, it fails to replicate the real scenario, particularly when the network experiences pressure-deficient situations. Numerous researchers formulated different head–discharge relations and used them iteratively with demand-driven software, while some other approaches solve them by incorporating this relation within the analysis algorithms. Several attempts have been made by adding fictitious network elements like reservoirs, check valves (CVs), flow control valves (FCVs), emitters, dummy nodes and pipes of negligible length (i.e., negligible pressure loss) to assess the supplying capability of a network under pressure-deficient conditions using demand-driven simulation software. This paper illustrates a simple way of assessing the supplying capacity of demand nodes (DNs) under pressure-deficient conditions by assigning the respective emitter coefficient only for those nodes facing a pressure-deficit condition. The proposed method is tested with three benchmark networks, and it is able to simulate the network without addition of any fictitious network elements or changing the source code of the software like EPANET. Though the proposed approach is an iterative one, the computational burden of adding artificial elements in the other methods is avoided and is hence useful for analyzing large networks.
Analysis of water distribution systems under pressure-deficient conditions presents a challenging research area, as understanding and simulating the real scenario is complex. It is well known that demand-driven analysis (DDA) simultaneously solves the mass balance and energy balance equations to determine the flow in each pipe for a given network topology and configuration. However, such a DDA solution does not represent an exact behavior of the system when it is under pressure-deficient conditions or if a bound on service pressure is assigned (Ang and Jowitt, 2006; Siew and Tanyimboh, 2012; Suribabu, 2015). It is possible to notice the negative pressure in DDA whenever the total loss of the head occurring from the source to node exceeds the available source head. This mainly happens when the demand assigned to a node is higher than what the pipes incident to that node can actually carry based on the available source head. To compute the actual outflows from the nodes within given pressure bounds, modifications are needed, either in the source code of a demand-driven simulation engine (e.g., Cheung et al., 2005) or by adding additional fictitious components like reservoirs, check valves (CVs), flow control valves (FCVs), emitters, dummy nodes and very short pipes to the demand nodes (DNs – e.g., Ozger, 2003; Ang and Jowitt, 2006; Rossman, 2007; Suribabu and Neelakantan, 2011; Jinesh Babu and Mohan, 2012; Gorev and Kodzhespirova, 2013; Sivakumar and Prasad, 2014, 2015; Morley and Tricarico, 2014; Abdy Sayyed et al., 2014, 2015; Suribabu, 2015; Suribabu et al., 2017; Mamizadeh and Sharoonizadeh, 2016; Mahmoud et al., 2017; Pacchin et al., 2017).
Mahmoud et al. (2017) addressed the shortcoming of each of these methods for evaluating outflow in the case of large networks and under extended-period simulation (EPS). They have developed a new way to handle PDA using EPANET in single-iterative type after an introduction of a check valve, a flow control valve and a flow emitter for both the steady state and EPS.
Pressure-driven analysis – literature review
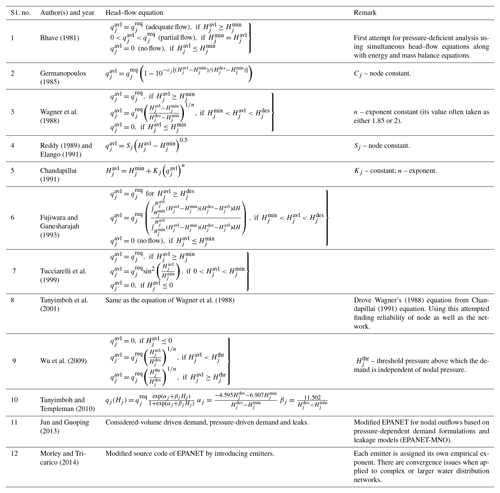
In the beginning, the pressure-deficient condition was considered a rare phenomenon and/or a typical problem in an operational scenario. However, when concern on reliability gained importance, the failure scenarios were analyzed, and thus analysis of the pressure-deficient condition became popular. Two approaches are popular for analyzing the pressure-deficient condition. In the first approach a specific pressure–demand relationship is embedded in the source code of the simulator (requires changing of the source code). Some of the important studies by several authors using this approach are presented in tabular form below (Table 1).
Apart from the above research in the table, Liu et al. (2011) and Siew and Tanyimboh (2012) adopted different methodologies to obtain node heads in EPANET. Giustolisi et al. (2011) developed and used new Excel-based software called WDNetXL. Generally, the limitations of this approach (Mahmoud et al., 2017) are that (1) it requires a change in algorithm and program code, (2) the computer codes are not available, (3) it requires iterations, (4) it is mostly demonstrated on sample networks, and (5) it exhibits difficulty in handling extended-period simulation.
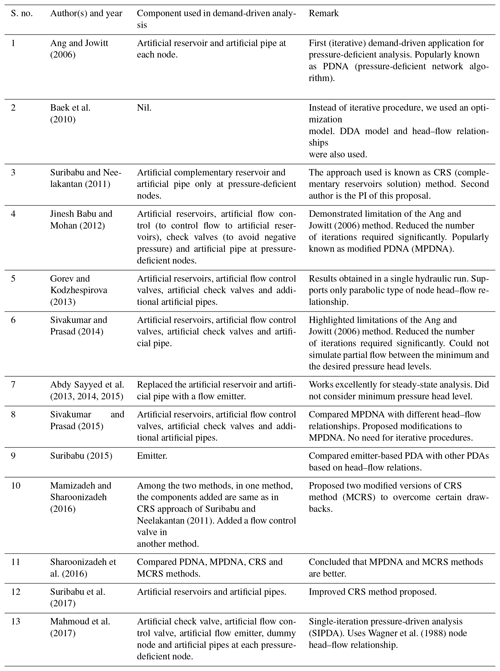
Some of the researchers in the recent years attempted pressure-deficient analysis using EPANET (popular freeware demand-driven model) by introduction of a few artificial or imaginary components but without node head–flow relationships. This research claims a lower number of iterations, and the recent research claims single iteration (no iteration). The works using components in the demand-driven model for pressure-deficient analysis are presented in Table 2.
A literature review indicates that the approach of using a demand-driven engine to get the pressure-driven results is getting more attention. This is due to computational convenience and the promising trend of development. Hence, this research is also planned to focus on this approach. This paper proposes a simple approach to suit both the single period and EPS but without addition, deletion, opening and closing of network elements. The proposed method requires only assigning an emitter coefficient and altering nodal elevation by incorporating minimum pressure head with existing elevation. Though the method is an iterative type, it can be easily implemented, irrespective of the size of the network.
2.1 Background of emitter-based approaches
The EPANET 2 (Rossman, 2000) hydraulic simulation engine contains a special element called the emitter that behaves as a sprinkler head at the node and delivers an outflow proportional to the available pressure head. Rossman (2007) discussed the possibility of building the pressure-driven network analysis proposed by Ang and Jowitt (2006) in the EPANET hydraulic solver using this emitter feature. Furthermore, Suribabu (2015) proposed a method to use the emitter as a replacement to the connection of fictitious reservoirs to all the DNs. Here, the emitter determines the possible supply at all deficient nodes based on its available pressure head. The flow from the emitter is expressed as follows (Rossman, 2000):
where Q is nodal outflow, Ke is the emitter coefficient, n is the emitter exponent and p is pressure. Rossman (2007) suggested that the value of the emitter coefficient can be calculated according to the properties of the pipe that connects the node and the artificial reservoir (i.e., diameter, length and Hazen–Williams coefficient) in order to make it equivalent to the approach of Ang and Jowitt (2006). Another emitter-based approach was proposed by Abdy Sayyed et al. (2015), which is a non-iterative method by connecting a CV, an FCV and an emitter to the demand nodes. Furthermore, they have shown that the emitter equation is identical to that of Wagner (1988) for if the emitter coefficient Ke and exponent γ are taken as follows:
where the nodal elevation of the emitter-set nodes is
Rossman (2000) also suggested that to get maximum flow at minimum pressure at demand nodes, the emitter coefficient shall be assigned to be 100 times the respective nodal demand. Hereafter it is referred to as Ke100 (coefficient of discharge):
In Abdy Sayyed et al. (2015), the FCV is used to fulfill the maximum flow constraint, and the CV is employed to avoid flow reversal. Single-iteration pressure-driven analysis (SIPDA) proposed by Mohmoud et al. (2017) adopted the same sequence of network elements as that of the Abdy Sayyed et al. (2015) approach. But SIPDA adds the sequence of network elements and modifies their nodal elevations only for those nodes experiencing a pressure deficit. Pacchin et al. (2017) used another new sequence of elements (general purpose valve – GPV, CV and artificial reservoir) to evaluate outflow from the node under pressure-deficient conditions. Pacchin et al. (2017) applied the proposed approach and other similar methods to two real water distribution networks and concluded that their proposed method and that of Abdy Sayyed et al. (2015) are able to correctly produce the behavior of the network under pressure-deficient conditions. However, the drawback of these methodologies is the need to include two dummy nodes per node, which further increases the number of components and the topological complexity of the network. Though the addition of elements make it a single snapshot analysis, its incorporation into each demand node makes the network too complex in topology. It consumes lot of time of the network modeler, unless a separate integrated component is created with a setting option in the existing software.
2.2 Assumptions
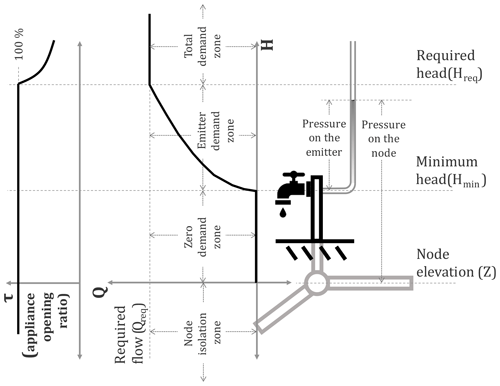
Many scientists (Bhave, 1981; Germanopoulos, 1985; Wagner et al., 1988; Reddy and Elango, 1989, 1991; Chandapillai, 1991; Fujiwara and Ganesharajah, 1993; Tucciarelli et al., 1999; Tanyimboh et al., 2001; Wu et al., 2009; Tanyimboh and Templeman, 2010) have suggested different head–flow relations for assessing the supplying capability of nodes under pressure-deficient conditions. Figure 1 presents an interpretation of the head–flow relations.
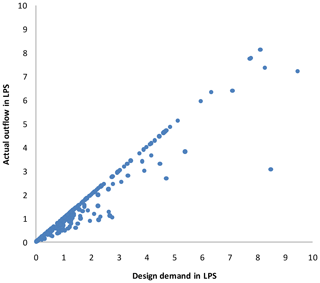
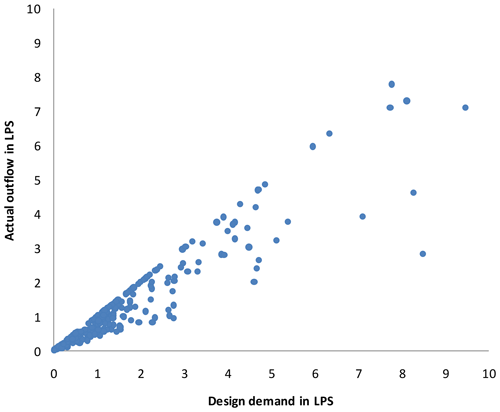
Figure 6Actual outflow against design demand under no supply from reservoir ID 272 (LPS – liters per second).
Given the variables defined in Fig. 1, there are different assumptions that the modeler can make:
-
The more general case is the one in which no assumption is made for Z, Hmin and Hreq. In this case the minimum possible head on a node is its elevation Z, and if hydraulic conditions do not permit this, then the node is isolated, meaning not only that demand in the node must be zero but also that there is no flow in the adjacent pipes (i.e., no siphonic flow is considered). If the head is between Z and Hmin, then the demand at the node is still zero, but now flow in the adjacent pipes can happen if hydraulic conditions downstream permit it. If the head is between Hmin and Hreq, then the demand at the node is only partially fulfilled even though the appliance or appliances are completely open; this is modeled with a transition curve which can take different forms (e.g, Germanopoulos, 1985; Bhave, 1989; Salgado-Castro, 1988; Wagner et al., 1988; Fujiwara and Li, 1998; Tanymboh and Templeman, 2010), although the Germanoupoulos (1985) emitter equation is commonly accepted as the most physically appropriate. If the head is above Hreq, then the pressure in the appliance is enough to fulfill the required demand, and therefore the appliances are assumed to be partially closed to receive only the required demand; this means that a demand-driven analysis of the node is suitable.
-
When Z<H is assumed (assuming that the actual junction elevation is below any possible value of H), this assumes that the water cannot ever reach the node isolation zone. Models that accept negative pressures in the system and flows downstream of these nodes are either making this assumption or assuming siphonic flow conditions (as long as the absolute pressure is above vapor pressure).
-
When Hmin=Z, this assumes that once there is some pressure in the node, there is some outflow. This assumption is valid when the node elevation actually represents the elevation of the lowest water demand appliance among all of the appliances lumped in it.
-
When Hreq=Hmin, this assumes that once the head is above the minimum head (i.e., pressure in the emitter is above zero), the outflow is equal to the required flow or, when this condition is not met, the maximum flow hydraulically possible flow. This assumption can be modeled using the Rossman (2000) approximation of using an emitter coefficient of 100⋅QReq.
The method proposed in this study requires no assumptions of Z, Hmin and Hreq, although it can deal with any of the ones mentioned above. This means that the only assumptions made in the proposed pressure-driven analysis (PDA) are as follows:
-
Though available pressure is greater than required pressure, the outflow at demand nodes does not exceed its design demand. This is a very basic assumption made by municipal engineering at the project formulation stage.
-
No outflow is possible at demand node if available pressure is less than minimum service pressure.
-
Pressure-dependent outflow between required and minimum pressures takes the form shown in Fig. 1, and for the corresponding condition, the percentage of the valve opening is defined by the curve.
-
The water distribution network is considered a non-airtight system. Hence, no siphonic flow is possible in the network.
-
Emitter coefficient is considered based on either Eq. (2) or 100 times the nodal demand to estimate the outflow at minimum residual pressure (Eq. 5).
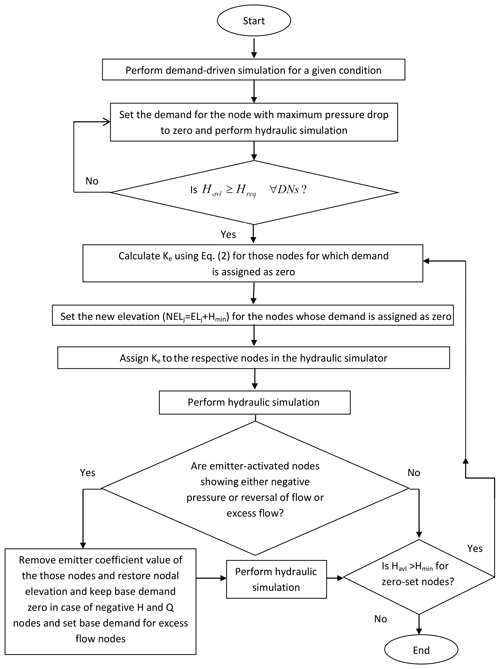
The present study proposes a simple approach by setting the emitter coefficient and changing the elevation of the nodes that have been identified as being pressure deficient through a few simulation runs of DDA. The proposed approach completely eliminates the serial inclusion of fictitious network elements at any node of the system. The entire procedure is illustrated by a flow chart shown in Fig. 2.
For a given condition, the network should initially be simulated using EPANET 2, identifying the maximum pressure-deficient node and setting its demand as zero. This process should be implemented repeatedly until all the nodes reach the condition Havl≥Hreq. It should be noted here that all non-zero nodes could deliver the design demand. Then, increase the elevation of zero-set nodes to Hmin (ie. ELj+Hmin) and calculate the emitter coefficient to be assigned to those nodes. Next, the network is simulated again. If a negative flow takes place at any emitter-set node, then remove the emitter value of those nodes, perform DDA again and interpret the results. Now there are chances of Havl going below Hmin in some nodes as the coefficient of the emitter with negative flows is set to zero. Here such nodes cannot behave as sources. Hence, if pressure in some nodes becomes less than minimum pressure, then set the zero demand again, change the nodal property as mentioned above and simulate the network. The analysis ends only if no negative flow exists and none of the non-zero demand nodes experience Havl less than Hmin. At the end of the analysis, if any nodes show negative pressure, then close the pipes incident to those nodes and simulate again to get a final solution. The procedure is illustrated further by a flow chart (Fig. 2).
The proposed methodology was experimented with three benchmark networks. The results of example 1 and 2 were compared with SIPDA, proposed by Mahmoud et al. (2017).
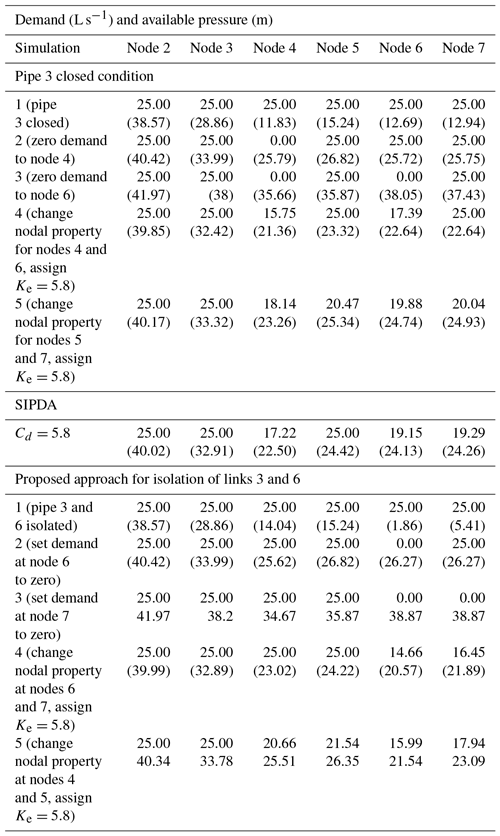
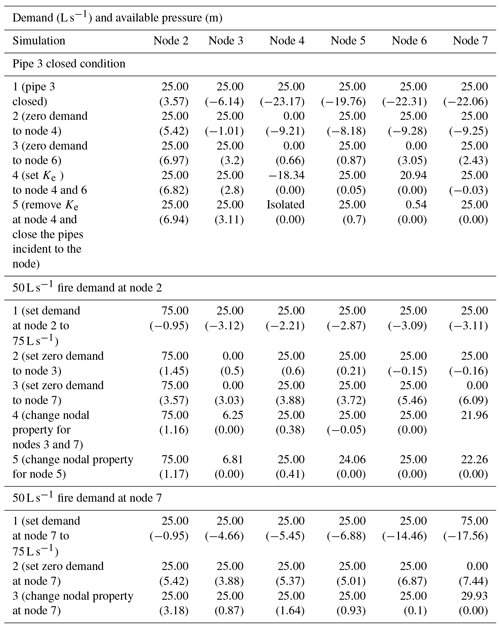
Table 3Step-by-step analysis results showing nodal outflows and pressure at each level of simulation. Bracketed values denote available pressure in meters.
3.1 Example 1
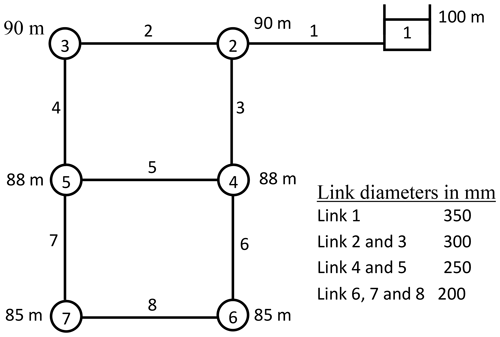
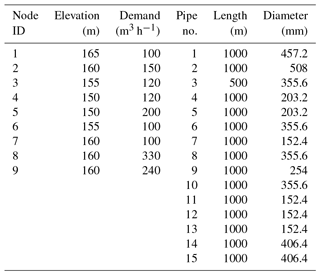
A single-fixed source-head two-loop network with six demand nodes and eight links (proposed by Ang and Jowitt, 2006, for PDA) is considered for illustrating the proposed approach (see Fig. 3). Each pipe is 1000 m long, with a Hazen–Williams coefficient of 130. The nodal demand for each node is 25 L s−1. DDA shows the full delivery of design demand at the respective elevation under normal conditions. To test the proposed algorithm, three scenarios were considered: (i) the closing of pipe 3, (ii) fire demand of 50 L s−1 at node 2 and (iii) fire demand of 50 L s−1 at node 7. Table 3 provides both DDA and proposed PDA results for all three scenarios. Equation (5) is used to simulate the pressure-flow relation (equivalent to a difference between required and minimum pressures below 0.001 m if using Eq. 2) with an emitter exponent of 0.54.
DDA shows negative pressure at all the demand nodes except node 2, while pipe 3 was isolated from service (scenario 1). Node 4 was observed as the maximum negative pressure node, and its nodal demand was set to zero. Again hydraulic simulation is carried out to verify whether all nodes turned into pressure above zero. But node 6 was still facing a higher pressure-deficit condition from nodes 3 to 7, and its demand was set to zero. After setting the emitter coefficient to both node 4 and 6, the hydraulic analysis shows a negative flow at node 4 and a negative pressure at node 7. By disconnecting pipes incident to node 4 and removing its Ke, the other outflows are computed. This scenario requires five demand-driven analyses to obtain PDA results. Furthermore, the same result was obtained using the SIPDA proposed by Mohmoud et al. (2017) after disconnecting incident pipes to node 4. SIPDA took three DDA runs after the addition of artificial links between network elements and five nodes.
In the next case (scenario 2), a fire demand of 50 L s−1 is created at node 2. The total demand at node 2 is changed to 75 L s−1. As this node is nearer to the source, there is more possibility to satisfy the extra demand. But DDA indicates negative pressure in all the nodes as the total demand of that node was increased by 3 times the design demand (i.e., 2 times higher than the existing demand). Nodal demand at node 3 and 7 was sequentially modified to zero after noticing negative pressure. Then, the network showed pressure greater than Hmin at these nodes. Hence, it is possible to partially deliver the flow to those nodes with demand set to zero. Then the emitter coefficient was set both to nodes 3 and 7, and the network was simulated. No negative pressure or negative flow was detected at these two nodes, but pressure at node 5 became negative. Changing nodal demand and setting the emitter coefficient at node 5 provided a final result after simulation. It can be seen that the network is able to supply full fire demand at node 2, full supply at nodes 4 and 6, and partial supply at nodes 3, 5 and 7. SIPDA provided the same result while emitter coefficient was taken to be 2500. Analysis by SIPDA necessitates addition of serial fictitious network elements to all the demand nodes as all the nodes experienced negative pressure at 50 L s−1 fire demand at node 2.
In the third scenario, a fire demand of 50 L s−1 at node 7 is added, and the network is simulated. Application of the proposed approach and SIPDA provided the same results.
3.2 Example 2
Network 1 was used as it is for further analysis by setting reservoir elevation to 135 m instead of 100 m. The minimum and required pressures at all the demand nodes are designated as 15 and 30 m respectively. DDA indicates that the network can supply design demand from all the demand nodes at the required pressure level of 30 m. SIPDA and the proposed approach require an emitter coefficient, Ke. For demand 25 L s−1 with Hreq=30 and Hmin=15 m, the emitter coefficient is obtained as 5.80 L s−1 m−0.54. The same value is utilized for both approaches to simulate the behavior of the network under isolation of link 3.
PDA was carried out by the proposed approach. DDA needs to be run five times, and results obtained are presented in Table 4. The proposed method indicates full supply of design demand at nodes 2 and 3, while the remaining nodes are able to supply only partial demand. For the same case study, SIPDA makes partial supply at nodes 4, 6 and 7, while recorded pressure is in between Hmin and Hreq. Though the pressure at node 5 is below Hreq, SIPDA indicates the full supply of demand instead of partial supply. The SIPDA result at this node violates the assumption of partial supply in between minimum and required pressure.
Furthermore, by closing two links, 3 and 6, the network was simulated, and DDA shows pressure below minimum at nodes 4, 5, 6 and 7. By applying proposed approach, actual demands and pressures were evaluated and presented in Table 4. Under the failure condition in pipes 3 and 6, the network is able to supply full design demand at nodes 2 and 3. The remaining nodes are able to supply partial demand only.
3.3 Example 3
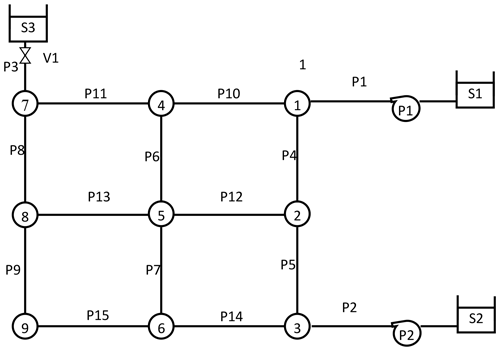
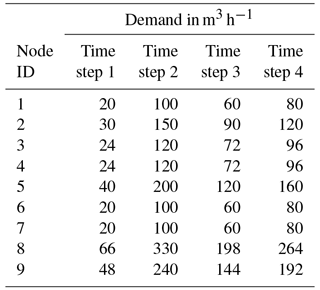
A multisource pumped water distribution network presented by Jinesh Babu and Mohan (2012) was considered for further testing of the proposed approach. Figure 4 shows the network layout, consisting of two pumps with the capacity of 125 kW each, instead of 125 hp, considered by Jinesh Babu and Mohan (2012), and was designed to deliver two-thirds of total demand. These two pumps, P1 and P2, pump the water from two sources, S1 and S2, respectively, whose elevations are 100 m each. The remaining one-third of total demand is drawn from reservoir, S3, whose elevation is 200 m, and one flow control valve is provided between reservoir S3 and node 7 in order to control the flow to one-third of total demand. A demand pattern with four intervals is considered with demand factors (DFs) of 0.2, 1.0, 0.6 and 0.8, which represent time intervals of 0.00 to 6.00, 6.00 to 12.00, 12.00 to 18.00 and 18.00 to 24.00 h respectively. The optimal speed of pumps for the respective time interval needs to be set to 0.584, 1.0, 0.842 and 0.927. The Hazen–Williams roughness coefficient of 130 is assumed for all the pipes. As Jinesh Babu and Mohan (2012) did not specify the upper and lower service pressure limit to the network, it is assumed in the present study that the required and minimum pressures needed for each demand node as 30 and 15 m respectively. Table 5 presents the pipe and nodal properties of the network. Table 6 shows the required nodal outflows at four time steps.
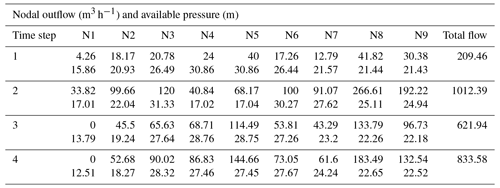
The pump 1 failure case was analyzed to examine the proposed approach. The results of EPS analysis for four time steps are presented in Table 7. This scenario produces partial flow at several nodes in all time steps. It is to be noted that in the first and second time steps, all nodes supply some water, whereas in the next two time steps, node 1 is unable to deliver even partial flow. Two nodes at time steps 1 and 2 indicates pressure greater than Hreq with full supply conditions, and all remaining nodes have an Havl between Hmin and Hreq, while in case of time step 3 and 4 no nodes were noticed where Havl is greater than Hreq. This indicates that the proposed approach is able to simulate the pressure-based flow when the network is energized by pumps, apart from gravity flow by the reservoir. The network is able to supply 71.17 %, 69.34 %, 70.99 % and 71.37 % of its total design demand at respective time steps. But it should be noted here that the drop in supply under failure of the component is not uniform in all the nodes. While optimizing the network, the various components of the network should be sized in such a way that, to a possible extent, all nodes are affected uniformly under failure of any component so that equity can be maintained under failure scenarios. PDA is becoming very important in achieving this.
3.4 Example 4
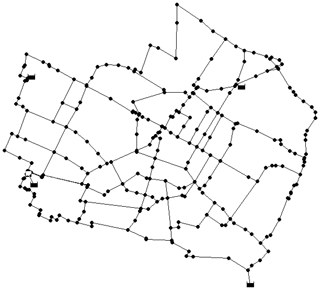
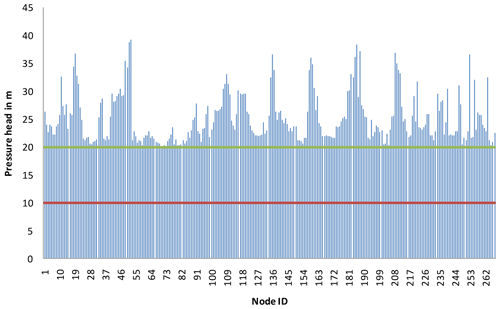
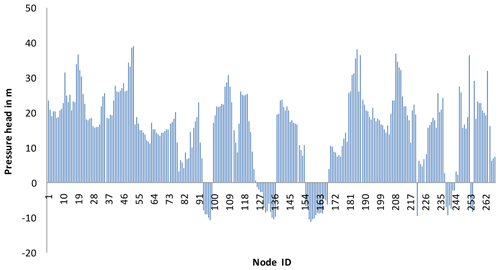
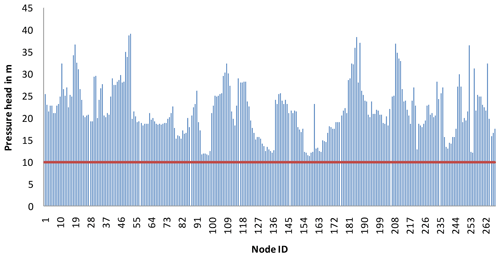
To examine the applicability of proposed approach on a large size benchmark network, a Modena network (MOD) given by the Centre for Water Systems at the University of Exeter (Wang et al., 2014) is considered. Its layout is shown in Fig. 5, and it consists of 317 pipes, 268 demand nodes and four reservoirs with a fixed head in the range of 72.0 to 74.5 m. In the present work, the layout, its diameter and a Hazen–Williams roughness coefficient of 130 are considered, as they are given by the network. The minimum and required pressures are assumed to be 10 and 20 m respectively. Supply from reservoir ID 272 is stopped fully by isolation of a pipe connecting the reservoir and nearest node. DDA indicates a pressure deficit (i.e., below Hreq) in 171 demand nodes. Using the EPANET toolkit, the proposed approach was implemented, and the results are presented in Fig. 6. Actual outflow versus the design demand plot (Fig. 6) shows the number of full supply and partial supply nodes. The trajectory of points lying along the diagonal line indicates full supply nodes, and points lying below the diagonal line denote partial supply against design demand. It is found from PDA that the network is able to supply 89.1 % of total demand while supply from reservoir ID 272 is ceased. Out of 268 nodes, 90 nodes are able to make partial supply to the consumers, and the remaining nodes could make the design supply. Figure 7 presents the distribution of nodal pressure under the no-component failure condition. The DDA indicates that pressure at all the nodes is above Hreq and hence full design supply is possible. Figure 8 indicates the distribution of nodal pressures when there is no supply from reservoir ID 272. The DDA shows the negative pressure at several nodes. From Figs. 6 and 9, it is evident that the proposed approach predicts nodal outflow corresponding to the pressure in all the nodes above Hmin.
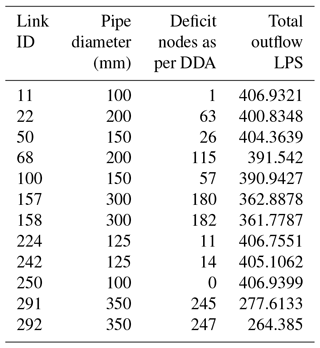
Furthermore, supply from reservoir ID 270 is closed, and the proposed approach was applied. It can be noticed that DDA showed that 232 nodes are pressure-deficient nodes. In the absence of supply from reservoir ID 270, the network is able to supply 78.46 % of total design demand. From Fig. 10, it is possible to notice the large number of supply nodes becoming affected in the absence of reservoir ID 270; 49 % of total nodes could deliver full design supply, and the remaining nodes could make only partial supply. Table 8 presents the total outflow from the network obtained by isolation of selected pipes. It is evident from the results that the proposed approach is able to find the nodal outflow under any pipe failure condition, apart from the pipe connecting the source.
Pressure-driven analysis (PDA) of the water distribution network estimates realistic outflow at all demand nodes while the network is under pressure-deficient conditions. Use of available network components like the reservoir, valves and emitter to simulate pressure-based outflow is found to be a simple approach, as it could be implemented easily for small networks without a change in the source code of commercial software. But the major bottleneck in adopting such an approach is that a large number of artificial components needs to be added to either all demand nodes or deficient nodes. This increases the complexity of the network configuration and also the burden to the computational part. The proposed approach does not utilize the artificial components other than emitter. The emitter is not a physical component to be added at the demand nodes. Instead it requires an appropriate coefficient to activate the emitter and estimate the outflow based on available pressure at the node. By changing the nodal properties to those nodes categorized as pressure deficit, the pressure-based outflow is able to evaluate by proposed iterative approach using the emitter option alone. From the analysis of the results, it is evident that the proposed approach can be easily implemented for various pressure limits.
The data for example network 4 is available at the following link http://emps.exeter.ac.uk/engineering/research/cws/resources/benchmarks/design-resiliance-pareto-fronts/ (Wang et al., 2014).
All authors made equal contributions to developing the algorithm and its application to example problems and writing the paper.
The authors declare that they have no conflict of interest.
The authors are grateful to the anonymous reviewers whose comments helped in improving the quality of the paper significantly.
Edited by: Luuk Rietveld
Reviewed by: two anonymous referees
Abdy Sayyed, M. A. H. and Gupta, R.: Predicting deficient condition performance of water distribution networks, J. Civil Eng. Infrastruct., 46, 161–173, https://doi.org/10.7508/ceij.2013.02.004, 2013.
Abdy Sayyed, M. A. H., Gupta, R., and Tanyimboh, T. T.: Modelling pressure deficient water distribution networks in EPANET, Procedia Engineer., 89, 626–631, https://doi.org/10.1016/j.proeng.2014.11.487, 2014.
Abdy Sayyed, M. A. H., Gupta, R., and Tanyimboh, T. T.: Noniterative application of EPANET for pressure dependent modelling of water distribution systems, Water Resour. Manag., 29, 3227–3242, https://doi.org/10.1007/s11269-015-0992-0, 2015.
Ang, W. K. and Jowitt, P. W.: Solution for water distribution systems under pressure-deficient conditions, J. Water Res. Plan. Man., 132, 175–182, https://doi.org/10.1061/(ASCE)0733-9496(2006)132:3(175), 2006.
Ang, W. K. and Jowitt, P. W..: Closure to “Solution of water distribution systems under pressure-deficient conditions” by W. K. Ang and P. W. Jowitt, J. Water Res. Plan. Man., 133, 571–572, https://doi.org/10.1061/(ASCE)0733-9496(2007)133:6(571), 2007.
Baek C. W., Jun, H. D., and Kim, J. H.: Development of a PDA model for water distribution systems using harmony search algorithm, KSCE J. Civ. Eng., 14, 613–625, https://doi.org/10.1007/s12205-010-0613-7, 2010.
Bhave, P. R.: Node flow analysis of water distribution systems, J. Transp. Eng., 107, 457–467, 1981.
Chandapillai, J.: Realistic simulation of water distribution system, J. Transp. Eng., 117, 258–263, https://doi.org/10.1061/(ASCE)0733-947X(1991)117:2(258), 1991.
Cheung, P. B., Van Zyl, J. E., and Reis, L. F. R.: Extension of EPANET for pressure driven demand modeling in water distribution system, Procedia Engineer., 1, 215–226, 2005.
Fujiwara, O. and Ganesharajah, T.: Reliability assessment of water supply systems with storage and distribution networks, Water Resour. Res., 29, 8 2917–2924, https://doi.org/10.1029/93WR00857, 1993.
Fujiwara, O. and Li, J.: Reliability analysis of water distribution networks in consideration of equity, redistribution and pressure dependent demand, Water Resour. Res., 34, 1843–1850, https://doi.org/10.1029/98WR00908, 1998.
Germanopoulos, G.: A technical note on the inclusion of pressure-dependent demand and leakage terms in water supply network models, Civ. Eng. Syst., 2, 171–179, https://doi.org/10.1080/02630258508970401, 1985.
Giustolisi, O., Savic, D. A., Berardi, L., and Laucelli, D.: An Excel based solution to bring water distribution network analysis closer to users, Proc., Computer and Control in Water Industry, Exeter Press, Exeter, UK, 2011.
Gorev, N. B. and Kodzhespirova, I. F.: Noniterative Implementation of Pressure-Dependent Demands Using the Hydraulic Analysis Engine of EPANET 2, Water Resour. Manag., 27, 3623, https://doi.org/10.1007/s11269-013-0369-1, 2013.
Jinesh Babu, K. S. and Mohan, S.: Extended Period Simulation for Pressure-Deficient Water Distribution Network, J. Comput. Civ. Eng., 26, 498–505, https://doi.org/10.1061/(ASCE)CP.1943-5487.0000160, 2012.
Jun, L. and Guoping, Y.: Iterative methodology of pressure dependent demand based on EPANET for pressure-deficient water distribution analysis, J. Water Res. Plan. Man., 139, 34–44, https://doi.org/10.1061/(ASCE) WR.1943-5452.0000227, 2013.
Liu, J., Yu, G., and Savic, D.: Deficient-network simulation considering pressure-dependent demand, Sustainable Solutions for Water, Sewer, Gas, and Oil Pipelines (ICPTT 2011), ASCE, Reston, VA, 2011.
Mahmoud, H. A., Aavic, D., and Kapelan, Z.: New pressure-driven approach for modeling water distribution networks, J. Water Res. Plan. Man., 143, 04017031-1-11, https://doi.org/10.1061/(ASCE)WR.1943-5452.0000781, 2017.
Mamizadeh, J. and Shaoonizadeh, S.: Application of modified complementary reservoir approach in analysis of water distribution networks under pressure deficient conditions, Urban Water. J., 14, 386–393, https://doi.org/10.1080/1573062X.2016.1171884, 2016.
Morley, M. S. and Tricarico, C.: Pressure driven demand extension for EPANET (EPANETpdd), Technical Rep. 2008, Univ. of Exeter, Exeter, UK, 2014.
Ozger, S.: A semi-pressure-driven approach to reliability assessment of water distribution networks, PhD dissertation, Department of Civil and environmental Engineering, Arizona State University, Temple, Ariz, 2003.
Pacchin, E., Alvisi, S., and Franchini, M.: A new non-iterative method for pressure-driven snapshot simulations with EPANET, Procedia Engineer., 186, 135–142, https://doi.org/10.1016/j.proeng.2017.03.219, 2017.
Reddy, L. S. and Elango, K.: Analysis of water distribution networks with head dependant outlets, Civ. Eng. Syst., 6, 102–110, 1989.
Reddy, L. S. and Elango, K.: A new approach to the analysis of water starved networks, J. Indian Water Works Assoc., 23, 31–38, 1991.
Rossman, L. A.: EPANET programmer's Toolkit Manual, Water Supply and Water Resources Division, National Risk Management Research Laboratory, U.S. Environmental Protection Agency, Cincinnati, 2000.
Rossman, L. A.: Discussion of “Solution of water distribution systems under pressure-deficient conditions” by W. K. Ang and P. W. Jowitt, J. Water Res. Plan. Man., 133, 566–567, https://doi.org/10.1061/(ASCE)0733-9496(2007)133:6(566.2), 2007.
Salgado-Castro, R. O.: Computer modelling of water supply distribution networks using the gradient method, PhD thesis, Univ. of Newcastle Upon Tyne, UK, 1988.
Sharoonizadeh, S., Mamizadeh, J., and Sarvarian, J.: Comparison of solution methods for analyzing water distribution networks under pressure-deficient Conditions, J. Water Supply Res. T., 65, 330–341, https://doi.org/10.2166/aqua.2016.084, 2016
Siew, C. and Tanyimboh, T. T.: Pressure-dependent EPANET extension, J. Water Resour. Manag., 26, 1477–1498, 2012.
Sivakumar, P. and Prasad, R. K.: Simulation of Water Distribution Network under Pressure-Deficient Condition, Water Resour. Manag., 28, 3271–3290, https://doi.org/10.1007/s11269-014-0677-0 2014.
Sivakumar, P. and Prasad, R. K.: Extended period simulation of pressure-deficient networks using pressure reducing valves, Water Resour. Manag., 29, 1713–1730, https://doi.org/10.1007/s11269-014-0907-5, 2015.
Suribabu, C. R.: Emitter based approach for estimation of nodal outflow to pressure deficient water distribution networks under pressure management, Sci. Iran. Trans. A, 22, 1765–1778, 2015.
Suribabu, C. R. and Neelakantan T. R.: Balancing reservoir based approach for solution to pressure deficient water distribution networks, Int. J. Civ. Struct. Eng., 2, 639–647, 2011.
Suribabu, C. R., Neelakantan, T. R., and Sivakumar, P.: Improved complementary reservoir solution to evaluate nodal outflow under pressure deficient conditions, ISH J. Hydraulic Eng., 23, 260–266, https://doi.org/10/1080/09715010.2017.1298060, 2017.
Tanyimboh, T. T. and Templeman, A. B.: Seamless pressure-deficient water distribution system model, Proc. of the Inst. of Civil Engrs. Water Manag., 163, 389–396, https://doi.org/10.1680/wama.900013, 2010.
Tanyimboh, T. T., Tabesh, M., and Burrows, R.: Appraisal of source head methods for calculating reliability of water distribution networks, J. Water Res. Plan. Man., 127, 206–213, https://doi.org/10.1061/(ASCE)0733-9496(2001)127:4(206), 2001.
Tucciarelli, T., Criminisi, A., and Termini, D.: Leak analysis in pipeline systems by means of optimal valve regulation, J. Hydraul. Eng., 125, 277–285, https://doi.org/10.1061/(ASCE)0733-9429(1999)125:3(277), 1999.
Wagner, J. M., Shamir, U., and Marks, D. H.: Water distribution reliability: Simulation methods, J. Water Res. Plan. Man., 114, 276–294, https://doi.org/10.1061/(ASCE)0733-9496(1988)114:3(276),1988.
Wang, Q., Guidolin, M., Savic, D., and Kapelan, Z.: Two-Objective Design of Benchmark Problems of a Water Distribution System via MOEAs: Towards the Best-Known Approximation of the True Pareto Front, J. Water Res. Plan. Man., 141, 04014060-1-14, https://doi.org/10.1061/(ASCE)WR.1943-5452.0000460, 2014 (data available at: http://emps.exeter.ac.uk/engineering/research/cws/resources/benchmarks/design-resiliance-pareto-fronts/, last access: 12 March 2019).
Wu, Z. Y., Wang, R. H., Walski, T. M., Yang, S. Y., Bowdler, D., and Baggett, C. C.: Extended global-gradient algorithm for pressure-dependent water distribution analysis, J. Water Res. Plan. Man., 135, 13–22, https://doi.org/10.1061/(ASCE)0733-9496(2009)135:1(13), 2009.


