the Creative Commons Attribution 4.0 License.
the Creative Commons Attribution 4.0 License.
Synthesis and characterization of erbium trioxide nanoparticles as photocatalyzers for degradation of methyl orange dye
Rifat Mohammed Dakhil
Tayser Sumer Gaaz
Ahmed Al-Amiery
Mohd S. Takriff
Abdul Amir H. Kadhum
The present work focuses on the photocatalytic degradation of methyl orange (MO) on erbium trioxide nanoparticles (Er2O3 NPs). In this study, Er2O3 nanoparticles were synthesized and fully characterized via various techniques, including X-ray diffraction, UV–visible spectroscopy and scanning electron microscopy techniques. The results revealed that the photocatalytic activity of the prepared Er2O3 NPs was manifested in MO photodegradation. The optimum efficiency obtained was 16 %.
One of the sources of water contamination was the wastewater generated from textile plants employing various dyestuffs (Khataee and Kasiri, 2010; Barbe et al., 1997). Various chemical and physical in addition to biological changes for dyes could occur that consume dissolved oxygen in the water bodies. Moreover, dyes have high toxicity, which endangers aquatic life (Khataee et al., 2009; Ruiz et al., 2004). The various traditional techniques employed for the processing of pollutant textile dyes in water involve different chemical, biological and/or physical techniques. Photocatalytic degradation was demonstrated as a promising technique for processing pollution that occurs due to organic and/or inorganic compounds. The approach, as a means of removal of persistent water contaminants like dyes and pesticides, has recently attracted the attention of numerous investigators (Xu et al., 2014; Chen et al., 2014; Liu et al., 2014). Many of these researchers used (aqueous) suspension of semiconductors irradiated by UV light to photodegrade the pollutants (Daneshvar et al., 2007). The accomplishment of a semiconductor photocatalyst was strongly connected with the electronic structure of it (Daneshvar et al., 2007; Boppella et al., 2013; Xiao et al., 2012; Alenezi et al., 2013). It was established that the photocatalytic degradation of organic ions or organic molecules in solution are launched by photogenerated holes in the valence band with electrons in the conduction band of the semiconductor photocatalyst. The generated holes have high oxidative potential that permits a direct oxidation of organic ions or organic molecules to reactive intermediates. Moreover, radicals are reactive species that may help in organic substrate degradation. As seen in Fig. 1, methyl orange (MO) is a scale of acidity utilized in titration due to its clear and distinct color difference at various pH values. Methyl orange demonstrates a pink color in acidic solutions and a yellow color in basic solutions. Due to it variations in color at the pH of a mid-strength acid, it is ordinarily utilized in titration for acid solutions. Unlike a global indicator, methyl orange does not have a full spectrum of color variation, but it has a sharp end (Khodja et al., 2001; Sandberg et al., 1972).
Generally, MO utilizes monoazo dye in laboratory tests, textiles and different commercial products and has to be eliminated from water because of its toxicity (Mittal et al., 2007; Chen et al., 2010). Mittal et al. (2007) researched the elimination and recovery of MO from wastewater employing waste materials. Chen and his coworkers (Chen et al., 2010) examined the equilibrium and kinetic aspects of MO adsorption on activated carbon derived from Phragmites australis. Jiang and other researchers (Jiang et al., 2012) investigated the removal of MO from solutions through maghemite–chitosan nanoparticles (NPs). Therefore, there is a need to develop a novel treatment method that is more effective in eliminating dyes from the wastewater. The objective and novelty of the present work is to study the factors affecting the photocatalytic oxidation process of methyl orange dye using the synthesized erbium trioxide nanoparticles, such as concentration, illumination time and the amount of catalyst loaded that is used in the photocatalytic process. In this investigation, we researched the photocatalytic degradation of MO on Er2O3 NPs.
2.1 Materials
All materials used in this work were supplied from Fluka Company and were used without further purification.
2.2 Synthesis of Er2O3NPs
Erbium oxide nanoparticles (Er2O3 NPs) were synthesized by dissolving ascorbic acid (1 g) and sodium fluoride (0.063 g) in distilled water (10 mL). The pH solution was adjusted to 4 by adding drops of ammonium hydroxide solution. The resulting solution was heated to 70 ∘C for 20 min. An alcoholic solution of erbium nitrate (2.5 g in 4 mL) was added to the above solution and continuously stirred for 2 h at room temperature. The precipitate was centrifuged and washed several times with de-ionized water dried in air for 24 h in a vacuum. The precipitate was then calculated at 800 ∘C for 3 h.
2.3 Sample preparation
Er2O3 nanoparticles were prepared as the catalyst of 0.1 g diluted in 100 mL methanol. Erbium oxide Er2O3 and methyl orange were weighed by using sensitive balance. MO is often used as a dye for catalytic tests (0.05 g diluted with 500 mL methanol).
2.4 Photocatalytic setup
The photocatalytic setup consists of a UV lamp (6 W) of cylindrical shape, 22 cm body length and 16 arccm length of cylindrical shape, which was used as a photo source. This lamp was positioned in a container of the sample (mixture of Er2O3 NPs and MO) and then placed on a magnetic stirrer (to mix and disperse solutions at high speeds and over a long time period to prepare it) (Chen et al., 2014).
2.5 Methods
2.5.1 Irradiation time effect
The mixture of Er2O3 NPs and MO was placed on the magnetic stirrer and the temperature was fixed at 25 ∘C. The UV lamp was switched on inside the sample container. Different irradiation times (1, 2, 3, 4 and 5 h) were employed. The photodegradation was measured after each hour. The samples were examined using a UV spectrometer to measure the absorbance of all samples.
2.5.2 Dye concentration effect
Different concentrations of the MO were used in the range of (0.1, 0.2, 0.5, 1, 1.5, 2) wt % and 0.1 wt % from Er2O3 NPs. The samples were withdrawn from the mixture without photocatalysts after 15 min for each concentration of MO. The samples were examined using a UV–visible spectrophotometer to measure the optical absorbance.
2.5.3 Scanning electron microscopy (SEM)
The morphology of the nanoparticles of erbium oxide nanoparticles was studied by scanning electron microscopy (SEM). It was recorded on the JEOL JSM-6390LV SEM fitted with a secondary electron detector.
2.5.4 X-ray diffraction (XRD)
The crystallinity of Er2O3 powder was studied using the X-ray diffraction (XRD) technique.
To improve the photodegradation efficiency of methyl orange dye, erbium trioxide nanoparticles were used as a common strategy. Erbium trioxide nanoparticles were ready to synthesis and cheap. Various types of nano-metal have been used in the previous studies, including anionic dopants, cationic dopants, rare-earth dopants, and codopants (Samadi et al., 2014). Additionally, many studies have shown that coupling with other semiconductors, such as CdO (Liu et al., 2014), CeO2 (Uddin et al., 2012), SnO2, TiO2 (Pant et al., 2012), graphene oxide (GO) (Dai et al., 2014), and reduced grapheme oxide (RGO) (Zhou et al., 2012), is a feasible approach to enhance the photodegradation efficiency.
3.1 Absence of sunlight
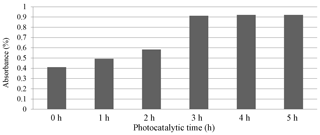
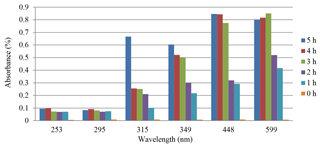
The results of the methods with and without sunlight (SL) were discussed and are shown in Figs. 2 and 3. Figure 2 demonstrates the relation between the absorbance and time of photocatalysis without sunlight radiation. The increase in the time of photodegradation up to 3.0 h leads to the absorbance values rising, due to the degradation process of organic dye. This is consistent with the findings of Lazar et al. (2012). Figure 3 shows the absorption of the Er2O3 spectrum in the absence of sunlight, and it can be seen that the minimum absorption occurs at a wavelength range of 324–489 nm for various irradiative times.
Figure 3 shows the absorption spectrum of Er2O3 nanoparticles without SL. It can be seen that the minimum absorption takes place at the 450–600 nm range of wavelength for different irradiative times. A transmission spectrum has maximum intensities at wavelengths where the absorption is weakest because more light is transmitted through the sample. An absorption spectrum has maximum intensities at wavelengths where the absorption is strongest. When sample molecules are exposed to light with an energy that matches a possible electronic transition within the molecule, some of the light energy will be absorbed as the electron is promoted to a higher energy orbital. An optical spectrometer records the wavelengths at which absorption occurs, together with the degree of absorption at each wavelength. Absorbance usually ranges from 0 to 3.5 and is precisely defined in context with spectrometer operation.
3.2 In presence of SL
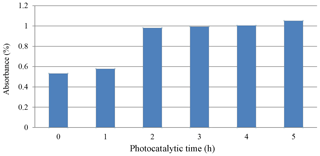
Figure 4 shows the photocatalytic degradation of diazocompounds irradiated under sunlight in the presence of Er2O3 nanoparticles. The presence of Er2O3 nanoparticles was investigated as a very important factor for improvement of the degradation process. Higher efficiency of degradation was found within 4.0 h of irradiation time considering the optimum loading of catalyst. After 4.0 h of irradiation time with Er2O3 nanoparticles, another peak can be seen at irradiation time of 5.0 h. We carried out a comparison between the absorbance values at 5 h with and without sunlight (Fig. 2) and found an improvement in the phenolic compound degradation when the role of sunlight is taken into account.
The rate of reaction increases and maximum rates were obtained after 4 h, as shown in Fig. 5. It may be explained by the fact that the operation time of UV source was increased, the number of photons per unit area incident on the sample also increased, resulting in a high rate of degradation in the mixture of erbium oxide and MO, which leads to an increase in the absorption value.
3.3 Impact of methylene blue concentration
3.3.1 Concentration of MO effects without irradiation
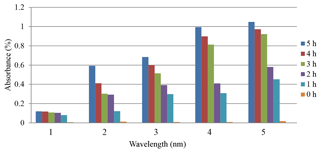
The increase in the dye concentration leads to increases in absorbance. The maximum change in absorbance was noticed when the concentration changed from 0.5 wt % to 1 wt %, as shown in Fig. 6. The degradation efficiency of MO was analyzed using a UV–visible spectrometer. Peaks were observed to be present between 450 and 600 nm, which was indicative of the degradation of MO. According to the Beer–Lambert law, MO concentration is directly proportional to its absorbance (Ramli et al., 2014).
3.3.2 Concentration of MO effects with irradiation
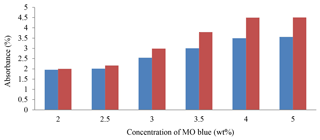
When MO concentration increases, the value of absorbance increases after 15 min from irradiation. The maximum increase in absorbance was noticed when the concentration at the range 0.5–1.0 wt % was changed, as shown in Fig. 6. This might be explained based on the increase in dye concentrations that leads to the reaction average increase as additional molecules. When the dye is increased (3.0–5.0 wt %) the value of absorbance remains constant at 4.51 wt %, causing reaction retardation because of the increasing number of collisions between dye molecules, whereas collisions between dye and salt decrease. As a conclusion, the proportion of the reaction decreased (Karunakaran et al., 2004; Pandey et al., 2015). The main rate of degradation exists in the region near the irradiated side where the intensity of irradiation was much higher than on the other sides. Thus, using dye with a higher concentration, the degradation technique decreases at sufficiently long distances from the light source or the reaction zone because of retardation in the penetration of light.
3.3.3 SEM results
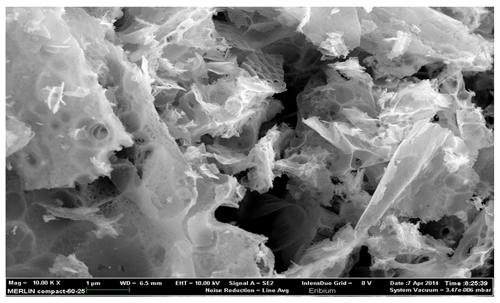
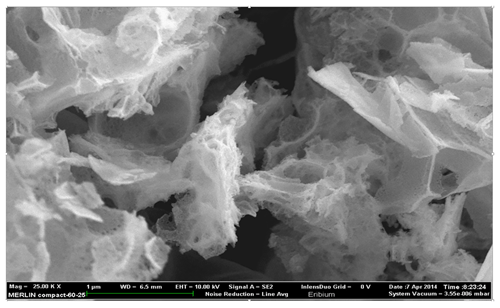
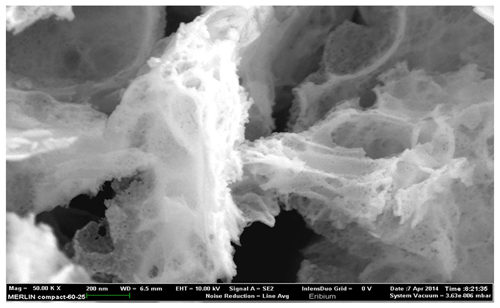
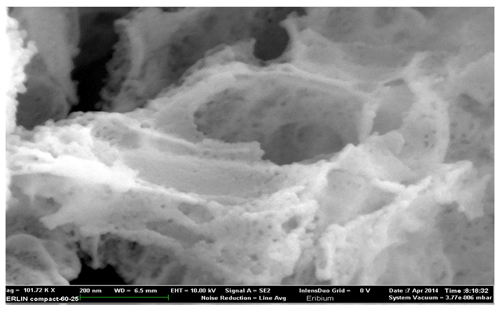
The SEM micrographs of synthesized samples are shown in Figs. 7, 8, 9 and 10, showing the distribution and the morphology of Er2O3 nanoparticles. The average size of the nanoparticles was found to be ∼16 nm and appeared to be uniform.
3.4 XRD results
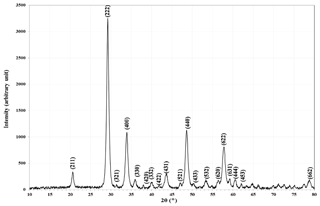
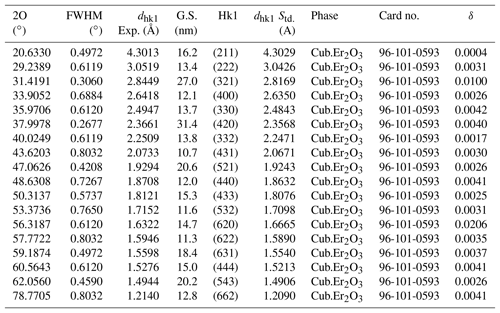
XRD was used to clarify the Er2O3 nanoparticles phase formation. All the reflections were well indexed to cubic phase of Er2O3 nanoparticles and can be seen in Fig. 11. The XRD parameters of Er2O3 nanoparticles are shown in Table 1 with a space group of I 21 3 (199) and cell parameters of a=10.5400 Å. The excellent crystallinity and absence of impurities can be inferred because of the sharpness and exact number of peaks in the XRD pattern. Additionally, it indicates that the product is a single phase. XRD was used to clarify the Er2O3 nanoparticle phase formation. All the reflections were well indexed to the cubic phase of Er2O3 nanoparticles, and the average crystallite size of Er2O3 nanoparticles was found to be 16 nm.
Nanoparticles of Er2O3 under SL improved the effectiveness of the degradation of diazonium compounds for methyl orange or, in other words, removal of mixture polluted by methyl orange. The photocatalytic activity under UV and light illumination are components for the enhanced photosynergist reactivity of the Er2O3. The Er2O3 nanoparticles have a stage and are ready to ingest a high measure of photocatalysis in the obvious light area, driving adequately photochemical degradation responses. The maximum increase in absorbance was noticed when the concentration of MO increased from 0.5 wt % to 1 wt %, and this behavior leads to increasing degradation of MO of up to 14 % for the Er2O3 catalyst. XRD measurements show that the structure of Er2O3 nanoparticles was cubic, and the average crystallite size of Er2O3 nanoparticles was found to be 16 nm.
The datasets generated and/or analyzed during the current study are available from the corresponding author on reasonable request.
RMD did the experimental work. TSG contributed to writing the paper. MST and AAHK supervised the whole work. AA was the principal investigator and contributed to writing the paper.
The authors declare that they have no conflict of interest.
The authors gratefully acknowledge the UKM-YSD Chair on Sustainable Development for supporting this work with the grant 020–2017 “Malaysia”.
This paper was edited by Talis Juhna and reviewed by two anonymous referees.
Alenezi, M. R., Alshammari, A. S., Jayawardena, K. I., Beliatis, M. J., Henley, S. J., and Silva, S.: Role of the exposed polar facets in the performance of thermally and UV activated ZnO nanostructured gas sensors, J. Phys. Chem. C, 117, 17850–17858, https://doi.org/10.1021/jp4061895, 2013.
Barbe, C. J., Arendse, F., Comte, P., Jirousek, M., Lenzmann, F., Shklover, V., and Grätzel, M.: Nanocrystalline titanium oxide electrodes for photovoltaic applications, J. Am. Ceram. Soc., 80, 3157–3171, https://doi.org/10.1111/j.1151-2916.1997.tb03245.x, 1997.
Boppella, R., Anjaneyulu, K., Basak, P., and Manorama, S. V.: Facile synthesis of face oriented ZnO crystals: tunable polar facets and shape induced enhanced photocatalytic performance, J. Phys. Chem. C, 117, 4597–4605, https://doi.org/10.1021/jp311443s, 2013.
Chen, J., Li, S., Ma, S., and Wang, X.: Polar Fuzzy Sets: An Extension of Bipolar Fuzzy Sets, Sci. World J., 2014, 416530, https://doi.org/10.1155/2014/416530, 2014.
Chen, S., Zhang, J., Zhang, C., Yue, Q., Li, Y., and Li, C.: Equilibrium and kinetic studies of methyl orange and methyl violet adsorption on activated carbon derived from Phragmites australis, Desalination, 252, 149–156, 2010.
Dai, K., Lu, L., and Liang, C.: Graphene oxide modiied ZnO nanorods hybrid with high reusable photocatalytic activity under UV-LED irradiation, Mater. Chem. Phys., 143, 1410–1416, 2014.
Daneshvar, N., Rasoulifard, M., Khataee, A., and Hosseinzadeh, F.: Removal of CI Acid Orange 7 from aqueous solution by UV irradiation in the presence of ZnO nanopowder, J. Hazard. Mater., 143, 95–101, 2007.
Jiang, R., Fu, Y. Q., Zhu, H. Y., Yao, J., and Xiao, L.: Removal of methyl orange from aqueous solutions by magnetic maghemite/chitosan nanocomposite films: adsorption kinetics and equilibrium, J. Appl. Polym. Sci., 125, E540–E549, https://doi.org/10.1002/app.37003, 2012.
Karunakaran, C., Senthilvelan, S., Karuthapandian, S., and Balaraman, K.: Photooxidation of iodide ion on some semiconductor and non-semiconductor surfaces, Catal. Commun., 5, 283–290, 2004.
Khataee, A. and Kasiri, M. B.: Photocatalytic degradation of organic dyes in the presence of nanostructured titanium dioxide: influence of the chemical structure of dyes, J. Mol. Catal. A-Chem., 328, 8–26, 2010.
Khataee, A., Pons, M. N., and Zahraa, O.: Photocatalytic degradation of three azo dyes using immobilized TiO2 nanoparticles on glass plates activated by UV light irradiation: Influence of dye molecular structure, J. Hazard. Mater., 168, 451–457, 2009.
Khodja, A. A., Sehili, T., Pilichowski, J.-F., and Boule, P.: Photocatalytic degradation of 2-phenylphenol on TiO2 and ZnO in aqueous suspensions, J. Photochem. Photobio. A, 141, 231–239, 2001.
Lazar, M., Varghese, S., and Nair, S.: Photocatalytic water treatment by titanium dioxide: recent updates, Catalysts, 2, 572–601, 2012.
Liu, B., Zhao, X., Terashima, C., Fujishima, A., and Nakata, K.: Thermodynamic and kinetic analysis of heterogeneous photocatalysis for semiconductor systems, Phys. Chem. Chem. Phys., 16, 8751–8760, 2014.
Liu, I., Hon, M., and Teoh, L.: Hepreparation, characterization and photocatalytic activity of radical-shaped CeO2/ZnO microstructures, Ceram. Int., 40, 4019–4024, 2014.
Mittal, A., Malviya, A., Kaur, D., Mittal, J., and Kurup, L.: Studies on the adsorption kinetics and isotherms for the removal and recovery of Methyl Orange from wastewaters using waste materials, J. Hazard. Mater., 148, 229–240, 2007.
Pandey, A., Kalal, S., Ameta, C., Ameta, R., Kumar, S., and Punjabi, P. B.: Synthesis, characterization and application of naïve and nano-sized titanium dioxide as a photocatalyst for degradation of methylene blue, J. Saudi Chem. Soc., 19, 528–536, 2015.
Pant, H., Park, C., Pant, P., Tijing, L., Kim, H., and Kim, C.: Synthesis, characterization, and photocatalytic properties of ZnO nano-lower containing TiO2 NPs, Ceram. Int., 38, 2943–2950, 2012.
Ramli, C., Amali, Z., Asim, N., Isahak, W. N., Emdadi, Z., Ahmad-Ludin, N., Yarmo, M. A., and Sopian, K.: Photocatalytic Degradation of Methylene Blue under UV Light Irradiation on Prepared Carbonaceous, Sci. World J., 2014, 415136, https://doi.org/10.1155/2014/415136, 2014.
Ruiz, A. M., Sakai, G., Cornet, A., Shimanoe, K., Morante, J. R., and Yamazoe, N.: Microstructure control of thermally stable TiO2 obtained by hydrothermal process for gas sensors, Sensor. Actuat. B-Chem., 103, 312–317, 2004.
Samadi, M., Pourjavadi, A., and Moshfegh, A.: Role of CdO addition on the growth and photocatalytic activity of electrospun ZnO nanoibers: UV vs. visible light, Appl. Surf. Sci., 298, 147–154, 2014.
Sandberg, R. G., Henderson, G. H., White, R. D., and Eyring, E. M.: Kinetics of acid dissociation-ion recombination of aqueous methyl orange, J. Phys. Chem., 76, 4023–4025, https://doi.org/10.1021/j100670a024, 1972.
Uddin, M., Nicolas, Y., and Olivier, C.: Nanostructured SnO2-ZnO heterojunction photocatalysts showing enhanced photocatalytic activity for the degradation of organic dyes, Inorg. Chem., 51, 7764–7773, 2012.
Xiao, Y., Lu, L., Zhang, A., Zhang, Y., Sun, L., Huo, L., and Li, F.: Highly enhanced acetone sensing performances of porous and single crystalline ZnO nanosheets: high percentage of exposed (100) facets working together with surface modification with Pd nanoparticles, ACS Appl. Mater. Inter., 4, 3797–3804, https://pubs.acs.org/doi/abs/10.1021/am3010303, 2012.
Xu, C., Rangaiah, G., and Zhao, X.: Photocatalytic degradation of methylene blue by titanium dioxide: experimental and modeling study, Indust. Eng. Chem. Res., 53, 14641–14649, https://doi.org/10.1021/ie502367x, 2014.
Zhou, X. Shi, T., and Zhou, H.: Hydrothermal preparation of ZnO-reduced graphene oxide hybrid with high performance in photocatalytic degradation, Appl. Surf. Sci., 258, 6204–6211, 2012.


